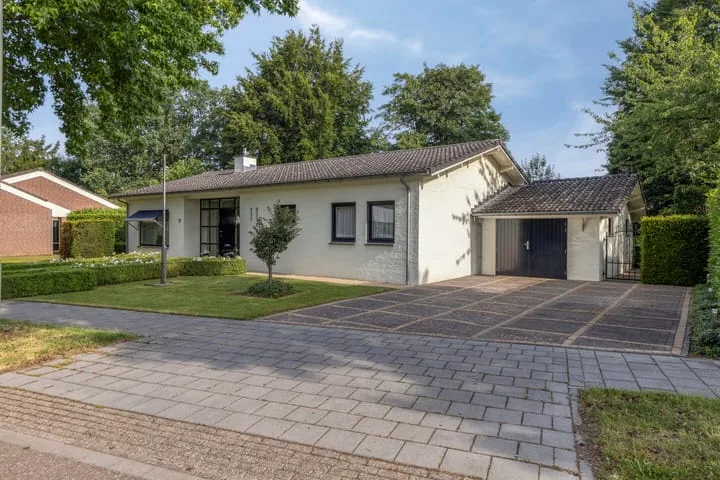
Houses sold in Mheer

View 7 sold houses in Mheer

Connected to: Vastgoed Nederland NVM Makelaars

On this page you will find recently sold homes in Mheer. Use this overview to better estimate selling prices, popular neighborhoods, and the local housing supply before you choose a real estate agent. Also view the current housing supply with 12 houses in Mheer.

Selection

Search and filter homes

Set your preferences and discover homes that suit you.

Total supply 242.717
Filters

Set price, area and other characteristics. Adjust a filter or click on Show homes. Location changes directly above.

Reset filters

You search for

  • Place Mheer
  • Status Sold

Huis verkopen in Mheer? Vergelijk verkoopmakelaars

Bekijk recente verkopen en ontvang gratis offertes van lokale makelaars. Vergelijk meer dan 47 makelaars in Mheer.

Free request a quote

  • Quotes in Mheer
  • Non-binding
  • Personal
  • Gratis tarieven vergelijken

Zelf je woning verkopen in Mheer? Vergelijk verkoopmakelaars in Mheer of bekijk de beste verkoopmakelaars in Mheer als referentie bij jouw keuze.

Vergelijk meerdere offertes

Makelaars maken scherpere voorstellen als ze weten dat je vergelijkt — vraag offertes aan voor verkoop of aankoop.

Frequently asked questions about sold homes in Mheer

Short answers about housing prices, sold homes and comparing real estate agents in Mheer.

Residential and neighborhood statistics in Mheer

View current location data on residents, WOZ development, housing stock, energy consumption, business activity and safety in Mheer. In 2026 were there 832 residents. The average WOZ value in 2025 is EUR 437.000.

These figures help to better assess and compare the housing stock in Mheer with recent sold homes. Orient yourself then on suitable top real estate agents in Mheer for sales advice in this region.

Residents

832

Last year: 2026

Average WOZ

EUR 437.000

Last year: 2025

Average income per person.

EUR 38.100

Source: AllNumbers

Crimes (current year)

5

Total registered

Demographics and WOZ development

Inhabitants per year

Inhabitants per year in Mheer
Year Residents
2021 855
2022 865
2023 845
2024 840
2025 835
2026 832

Annual WOZ value

WOZ value per year in Mheer
Year Average WOZ
2021 EUR 315.000
2022 EUR 332.000
2023 EUR 395.000
2024 EUR 405.000
2025 EUR 437.000

Composition of residents

Age build-up

65+: 290 0-15: 95 15-25: 65 25-45: 150 45-65: 255

Education level

Hoger

260

Praktisch

100

Middelbaar

260

Origin of residents (2025)

Europa

90

Nederland

720

Buiten Europa

30

Housing stock and construction periods

Types of homes

Hoekwoningen 48
Appartementen 45
Tussenwoningen 68
Vrijstaande woningen 153
Twee-onder-één-kap woningen 93

Construction period of buildings

Voor 1700 4
1700 tot 1900 65
1900 tot 1925 10
1925 tot 1950 20
1950 tot 1970 71
1970 tot 1980 112
1980 tot 1990 44
1990 tot 2000 38
2000 tot 2010 29
2010 tot 2020 8
2020 en later 2

Energy and sustainability

Energy label distribution

Label C

97

Label G

77

Label D

70

Label B

62

Label F

46

Label A

44

Label E

13

Label A+

3

Label A++

1

Label A+++

0

Label A++++

0

Label A+++++

0

Average energy consumption per year

Average energy consumption per year in Mheer
Year Gas (m3) Electricity (kWh)
2020 1.780 3.290
2021 2.030 3.340
2022 1.620 3.160
2023 1.330 3.020
2024 1.310 3.140

Consumption per house type

Hoekwoning

Gas: 1.190 • Electricity: 2.580

Huurwoning

Gas: 1.130 • Electricity: 2.540

Koopwoning

Gas: 1.380 • Electricity: 3.140

Appartement

Gas: 1.200 • Electricity: 2.510

Tussenwoning

Gas: 1.150 • Electricity: 2.810

Vrijstaande woning

Gas: 1.570 • Electricity: 3.560

Twee-onder-één-kap woning

Gas: 1.230 • Electricity: 2.780

Business activity in Mheer (2025)

Handel en HORECA 15
Nijverheid en energie 10
Zakelijke dienstverlening 45
Overheid, onderwijs en zorg 35
Landbouw, bosbouw en visserij 10
Vervoer, informatie en communicatie 5
Financiele diensten en onroerendgoed 10
Cultuur, recreatie en overige diensten 5

Total number of company establishments: 135

Recent crime statistics

Recent crime statistics in Mheer
Period Crimes
jan 2026 1
jul 2025 0
jun 2025 0
mei 2025 0
mrt 2025 1
mrt 2026 1
nov 2024 0
nov 2025 0
okt 2024 3
okt 2025 1
sep 2024 0
sep 2025 0

These figures give an indicative picture of safety trends in the living environment of Mheer.

Frequently asked questions about living in Mheer

Short answers based on current local statistics, handy for a quick comparison of the living environment.

Hoeveel inwoners heeft Mheer?

Mheer telt in 2026 ongeveer 832 inwoners.

Wat is de gemiddelde WOZ-waarde in Mheer?

De gemiddelde WOZ-waarde in Mheer is in 2025 circa € 437.000.

Wat is het gemiddelde inkomen per inwoner in Mheer?

Het gemiddelde inkomen per inwoner in Mheer ligt rond € 38.100 per jaar.

Hoe veilig is wonen in Mheer?

Voor het huidige jaar gaat het om ongeveer 5 geregistreerde misdrijven. Gebruik deze cijfers als indicatie en vergelijk trends per periode.

Welke woningtypen komen het meest voor in Mheer?

In Mheer komt vooral "Vrijstaande woningen" veel voor, met ongeveer 153 woningen.

Receive free, non-binding quotes

Compare multiple real estate agents and choose the best match.