- Sold
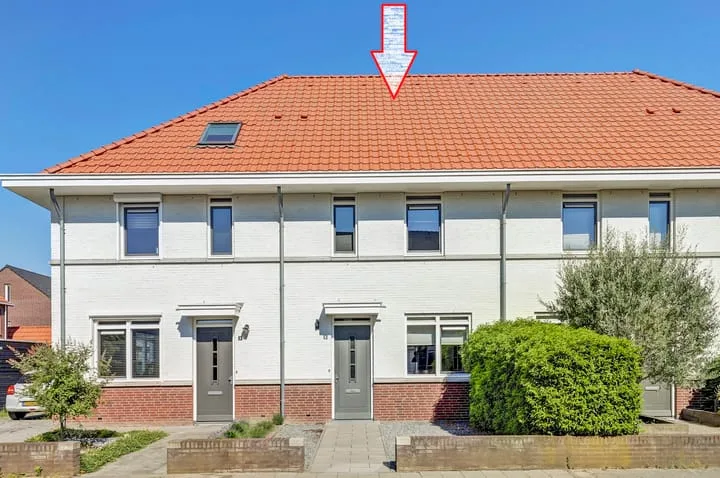
Bessie Smithstraat 7
4337WT Middelburg
€ 499.000 k.k.
€ 3.751/m²
- Living area
- 133 m²
- Land area
- 182 m²
- Bedrooms
- 3
View 465 sold houses in Middelburg
Type to search. Use arrow down and arrow up to navigate through results and press Enter to open.
Hidden search suggestions.
Compare sold homes in Middelburg or view the current offering in this location directly.
On this page you will find recently sold homes in Middelburg. Use this overview to better estimate selling prices, popular neighborhoods, and the local housing supply before you choose a real estate agent. Also view the current housing supply with 712 houses in Middelburg.
4337WT Middelburg
€ 499.000 k.k.
€ 3.751/m²
4333HJ Middelburg
€ 485.000 k.k.
€ 4.330/m²
4332DJ Middelburg
€ 499.000 k.k.
€ 3.138/m²
4333DC Middelburg
€ 279.000 k.k.
€ 3.206/m²
4336HG Middelburg
€ 250.000 k.k.
€ 2.232/m²
4332TS Middelburg
€ 249.000 k.k.
€ 3.276/m²
4332XN Middelburg
€ 229.500 k.k.
€ 3.101/m²
4336GP Middelburg
€ 275.000 k.k.
€ 2.370/m²
4337PH Middelburg
€ 419.000 k.k.
€ 3.273/m²
4331BP Middelburg
€ 620.000 k.k.
€ 4.626/m²
4336KN Middelburg
€ 309.000 k.k.
€ 3.358/m²
4333HJ Middelburg
€ 479.000 k.k.
€ 3.801/m²
4332XT Middelburg
€ 285.000 k.k.
€ 4.830/m²
4332XL Middelburg
€ 325.000 k.k.
€ 3.217/m²
4333GV Middelburg
€ 1.275.000 k.k.
€ 5.567/m²
4337LD Middelburg
€ 319.000 k.k.
€ 2.981/m²
4335GG Middelburg
€ 369.000 k.k.
€ 3.804/m²
4331RR Middelburg
€ 445.000 k.k.
€ 3.111/m²
4336BM Middelburg
€ 215.000 k.k.
€ 2.828/m²
4335JG Middelburg
€ 289.000 k.k.
€ 3.958/m²
4337PJ Middelburg
€ 409.000 k.k.
€ 3.170/m²
4337AB Middelburg
€ 375.000 k.k.
€ 3.125/m²
4332DW Middelburg
€ 469.500 k.k.
€ 3.353/m²
4337PM Middelburg
€ 445.000 k.k.
€ 3.938/m²
4337AX Middelburg
€ 397.500 k.k.
€ 3.646/m²
4331WC Middelburg
€ 485.000 k.k.
€ 4.449/m²
4332DT Middelburg
€ 695.000 k.k.
€ 4.064/m²
4337WJ Middelburg
€ 445.000 k.k.
€ 3.869/m²
Get free quotes from realtors with local market knowledge in Middelburg.
Selling a home in Middelburg? Compare real estate agents who know the local housing market. Also check out all real estate agents in Middelburg or the top 10 real estate agents in Middelburg for extra context for your choice.
By comparing brokers and requesting quotes
Short answers about housing prices, sold homes and comparing real estate agents in Middelburg.
The costs of a real estate agent in Middelburg vary per office, property type and sales approach. Therefore, compare multiple quotes and also look at the real estate agents in Middelburg to better compare rates, presentation and local experience.
On this page we currently show 465 sold houses in Middelburg from our selection. This helps you to better assess recent transactions and the local housing market.
Houses sold in Middelburg give insight into asking prices, house types and neighborhoods where recent transactions have taken place. Compare this also with the current housing stock in Middelburg to better understand the market.
You can use sold homes as a first market indication, but a local real estate agent can better take into account finishing, location, maintenance and current demand in Middelburg.
Compare realtors in Middelburg on local sales experience, reviews, expected yield, commission and marketing approach. The top 10 realtors in Middelburg helps to quickly discover strong offices.
View current location data on residents, WOZ development, housing stock, energy consumption, business activity and safety in Middelburg. In 2025 were there 43.530 residents. The average WOZ value in 2025 is EUR 305.375.
These figures help to better assess and compare the housing stock in Middelburg with recent sold homes. Orient yourself then on suitable top real estate agents in Middelburg for sales advice in this region.
Residents
43.530
Last year: 2025
Average WOZ
EUR 305.375
Last year: 2025
Average income per person.
EUR 28.218
Source: AllNumbers
Crimes (current year)
2.278
Total registered
| Year | Residents |
|---|---|
| 2021 | 42.210 |
| 2022 | 42.480 |
| 2023 | 43.165 |
| 2024 | 43.300 |
| 2025 | 43.530 |
| Year | Average WOZ |
|---|---|
| 2021 | EUR 212.029 |
| 2022 | EUR 229.478 |
| 2023 | EUR 257.579 |
| 2024 | EUR 287.452 |
| 2025 | EUR 305.375 |
Hoger
10.380
Praktisch
7.230
Middelbaar
13.830
Europa
4.045
Nederland
32.215
Buiten Europa
7.265
Label A
5.863
Label C
5.125
Label B
3.497
Label F
1.840
Label D
1.765
Label G
1.634
Label E
1.325
Label A+
660
Label A+++
491
Label A++++
398
Label A++
236
Label A+++++
7
| Year | Gas (m3) | Electricity (kWh) |
|---|---|---|
| 2020 | 1.050 | 2.267 |
| 2021 | 1.207 | 2.373 |
| 2022 | 936 | 2.223 |
| 2023 | 813 | 2.107 |
| 2024 | 785 | 2.155 |
Hoekwoning
Gas: 984 • Electricity: 2.325
Huurwoning
Gas: 654 • Electricity: 1.703
Koopwoning
Gas: 918 • Electricity: 2.383
Appartement
Gas: 555 • Electricity: 1.511
Tussenwoning
Gas: 861 • Electricity: 2.162
Vrijstaande woning
Gas: 1.246 • Electricity: 3.258
Twee-onder-één-kap woning
Gas: 1.029 • Electricity: 2.429
Total number of company establishments: 5.315
| Period | Crimes |
|---|---|
| jan 2026 | 230 |
| jul 2025 | 212 |
| jun 2025 | 194 |
| mei 2025 | 224 |
| mrt 2025 | 165 |
| mrt 2026 | 175 |
| nov 2024 | 141 |
| nov 2025 | 188 |
| okt 2024 | 160 |
| okt 2025 | 209 |
| sep 2024 | 189 |
| sep 2025 | 205 |
These figures give an indicative picture of safety trends in the living environment of Middelburg.
Short answers based on current local statistics, handy for a quick comparison of the living environment.
Middelburg telt in 2025 ongeveer 43.530 inwoners.
De gemiddelde WOZ-waarde in Middelburg is in 2025 circa € 305.375.
Het gemiddelde inkomen per inwoner in Middelburg ligt rond € 28.218 per jaar.
Voor het huidige jaar gaat het om ongeveer 2.278 geregistreerde misdrijven. Gebruik deze cijfers als indicatie en vergelijk trends per periode.
In Middelburg komt vooral "Tussenwoningen" veel voor, met ongeveer 8.263 woningen.