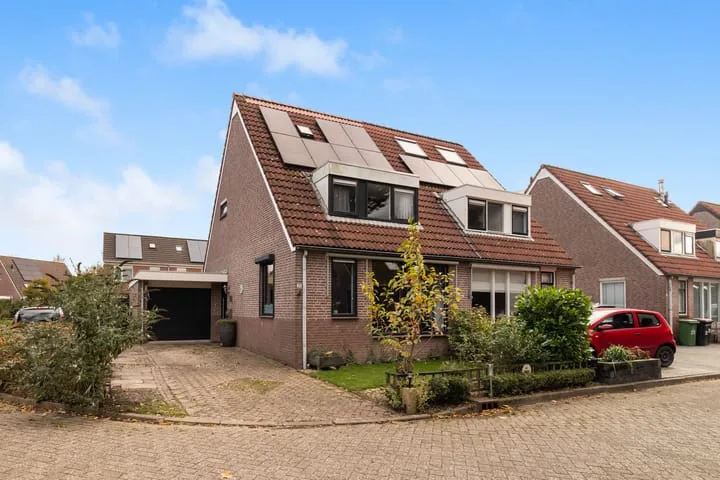
- Sold
Langeland 20
1679WE Midwoud
€ 369.000 k.k.
€ 3.153/m²
- Living area
- 117 m²
- Land area
- 110 m²
- Bedrooms
- 4
View 19 sold houses in Midwoud
Type to search. Use arrow down and arrow up to navigate through results and press Enter to open.
Hidden search suggestions.
Compare sold homes in Midwoud or view the current offering in this location directly.
On this page you will find recently sold homes in Midwoud. Use this overview to better estimate selling prices, popular neighborhoods, and the local housing supply before you choose a real estate agent. Also view the current housing supply with 27 houses in Midwoud.
1679WE Midwoud
€ 369.000 k.k.
€ 3.153/m²
1679XL Midwoud
€ 315.000 k.k.
€ 3.750/m²
1679XD Midwoud
€ 350.000 k.k.
€ 3.043/m²
1679WC Midwoud
€ 345.000 k.k.
€ 3.026/m²
1679GW Midwoud
€ 520.000 k.k.
€ 3.586/m²
1679GW Midwoud
€ 540.000 k.k.
€ 4.091/m²
1679XD Midwoud
€ 350.000 k.k.
€ 2.916/m²
1679VE Midwoud
€ 550.000 k.k.
€ 5.339/m²
1679VD Midwoud
€ 389.500 k.k.
€ 4.188/m²
1679XW Midwoud
€ 375.000 k.k.
€ 3.177/m²
1679GR Midwoud
€ 499.000 k.k.
€ 3.564/m²
1679GR Midwoud
€ 475.000 k.k.
€ 3.979/m²
1679GX Midwoud
€ 795.000 k.k.
€ 4.015/m²
1679VB Midwoud
€ 439.000 k.k.
€ 3.158/m²
1679GP Midwoud
€ 350.000 k.k.
€ 0/m²
1679VD Midwoud
€ 375.000 k.k.
€ 3.989/m²
1679XM Midwoud
€ 360.000 k.k.
€ 3.461/m²
1679WC Midwoud
€ 450.000 k.k.
€ 3.383/m²
1679XT Midwoud
€ 292.500 k.k.
€ 2.759/m²
Bekijk recente verkopen en ontvang gratis offertes van lokale makelaars. Vergelijk meer dan 42 makelaars in Midwoud.
Zelf je woning verkopen in Midwoud? Vergelijk verkoopmakelaars in Midwoud of bekijk de beste verkoopmakelaars in Midwoud als referentie bij jouw keuze.
Makelaars maken scherpere voorstellen als ze weten dat je vergelijkt — vraag offertes aan voor verkoop of aankoop.
Short answers about housing prices, sold homes and comparing real estate agents in Midwoud.
De kosten van een makelaar in Midwoud verschillen per kantoor, woningtype en verkoopaanpak. In Midwoud kun je 42 real estate agents vergelijken; bekijk daarom ook de makelaars in Midwoud om tarieven, presentatie en lokale ervaring beter naast elkaar te zetten.
On this page we currently show 19 sold houses in Midwoud from our selection. This helps you to better assess recent transactions and the local housing market.
Houses sold in Midwoud give insight into asking prices, house types and neighborhoods where recent transactions have taken place. Compare this also with the current housing stock in Midwoud to better understand the market.
You can use sold homes as a first market indication, but a local real estate agent can better take into account finishing, location, maintenance and current demand in Midwoud.
Vergelijk de 42 real estate agents in Midwoud op lokale verkoopervaring, reviews, verwachte opbrengst, courtage en marketingaanpak. Bekijk verkoopmakelaars in Midwoud of de top 10 makelaars in Midwoud om snel sterke kantoren te ontdekken.
View current location data on residents, WOZ development, housing stock, energy consumption, business activity and safety in Midwoud. In 2025 were there 2.510 residents. The average WOZ value in 2025 is EUR 393.000.
These figures help to better assess and compare the housing stock in Midwoud with recent sold homes. Orient yourself then on suitable top real estate agents in Midwoud for sales advice in this region.
Residents
2.510
Last year: 2025
Average WOZ
EUR 393.000
Last year: 2025
Average income per person.
EUR 33.800
Source: AllNumbers
Crimes (current year)
58
Total registered
| Year | Residents |
|---|---|
| 2021 | 2.415 |
| 2022 | 2.470 |
| 2023 | 2.525 |
| 2024 | 2.545 |
| 2025 | 2.510 |
| Year | Average WOZ |
|---|---|
| 2021 | EUR 271.000 |
| 2022 | EUR 304.000 |
| 2023 | EUR 353.000 |
| 2024 | EUR 368.000 |
| 2025 | EUR 393.000 |
Hoger
450
Praktisch
460
Middelbaar
990
Europa
235
Nederland
2.040
Buiten Europa
240
Label C
318
Label B
274
Label A
254
Label A+
75
Label D
54
Label G
54
Label A+++
35
Label F
22
Label A++
18
Label E
7
Label A++++
7
Label A+++++
0
| Year | Gas (m3) | Electricity (kWh) |
|---|---|---|
| 2020 | 1.290 | 2.990 |
| 2021 | 1.460 | 3.060 |
| 2022 | 1.130 | 2.830 |
| 2023 | 940 | 2.720 |
| 2024 | 890 | 2.850 |
Hoekwoning
Gas: 870 • Electricity: 2.610
Huurwoning
Gas: 720 • Electricity: 1.960
Koopwoning
Gas: 1.050 • Electricity: 3.080
Appartement
Gas: 740 • Electricity: 1.640
Tussenwoning
Gas: 830 • Electricity: 2.450
Vrijstaande woning
Gas: 1.320 • Electricity: 3.770
Twee-onder-één-kap woning
Gas: 900 • Electricity: 2.800
Total number of company establishments: 305
| Period | Crimes |
|---|---|
| jan 2025 | 4 |
| jan 2026 | 6 |
| jul 2025 | 5 |
| jun 2025 | 4 |
| mei 2025 | 2 |
| mrt 2025 | 3 |
| nov 2024 | 0 |
| nov 2025 | 4 |
| okt 2024 | 5 |
| okt 2025 | 3 |
| sep 2024 | 2 |
| sep 2025 | 7 |
These figures give an indicative picture of safety trends in the living environment of Midwoud.
Short answers based on current local statistics, handy for a quick comparison of the living environment.
Midwoud telt in 2025 ongeveer 2.510 inwoners.
De gemiddelde WOZ-waarde in Midwoud is in 2025 circa € 393.000.
Het gemiddelde inkomen per inwoner in Midwoud ligt rond € 33.800 per jaar.
Voor het huidige jaar gaat het om ongeveer 58 geregistreerde misdrijven. Gebruik deze cijfers als indicatie en vergelijk trends per periode.
In Midwoud komt vooral "Tussenwoningen" veel voor, met ongeveer 394 woningen.