Residents
3.771
Last year: 2026
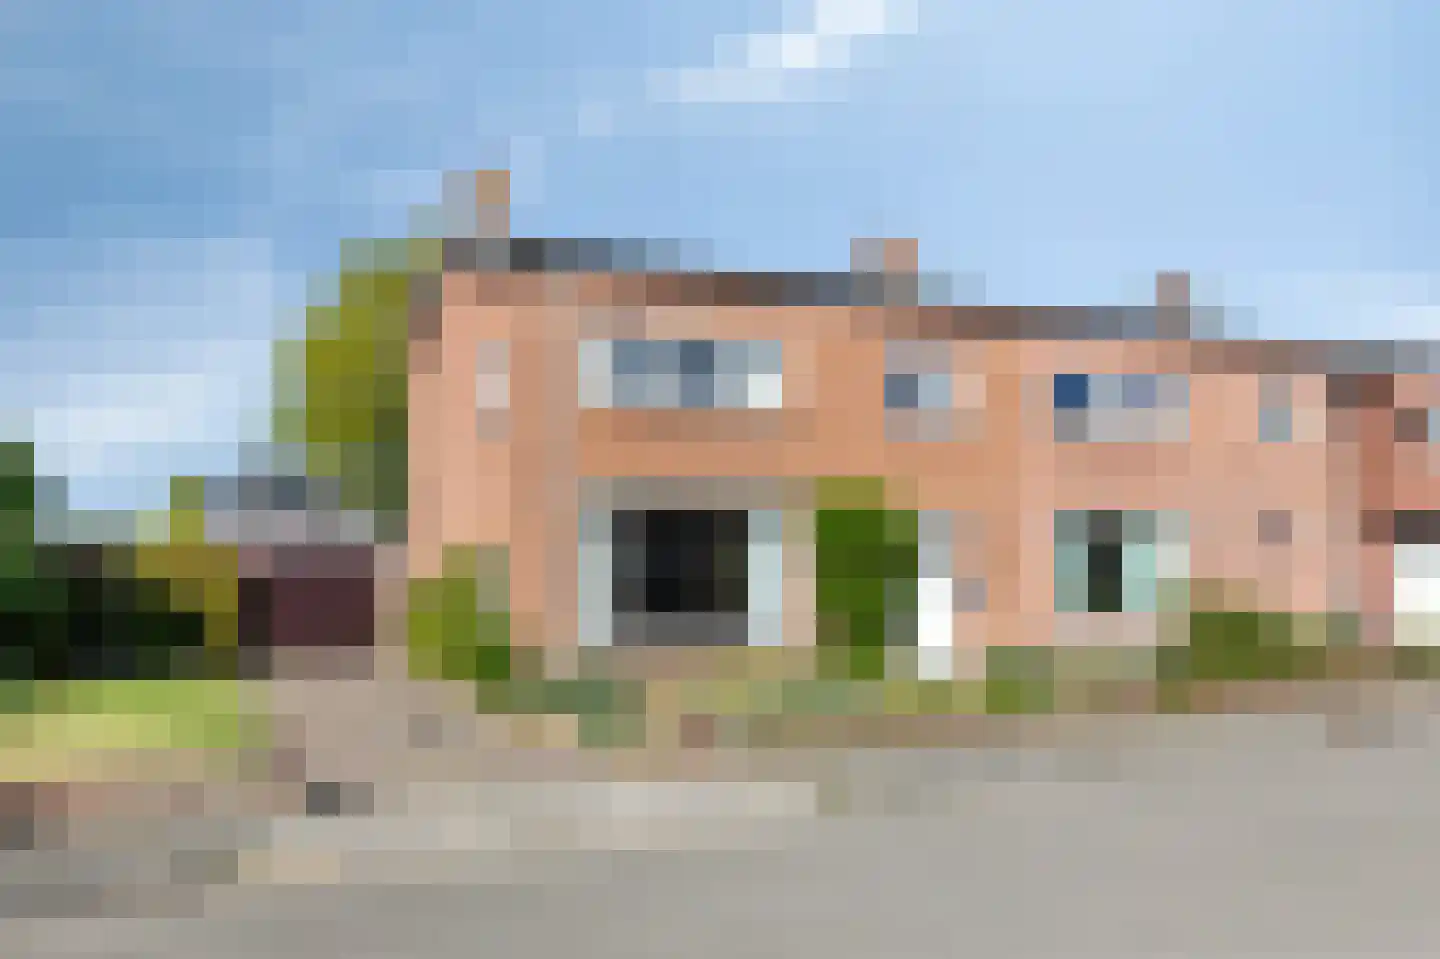
6584AL Molenhoek • Limburg
€ 498.000 k.k.
Cost of copper (estimated): € 11.810
2% transfer tax (€ 9.960) + notary (€ 1.150) + valuation (€ 700)
Total incl. VAT: € 509.810
For this property, no detailed description is available yet.
€ 498.000
Cost of copper (estimated): € 11.810
2% transfer tax (€ 9.960) + notary (€ 1.150) + valuation (€ 700)
Total purchase (incl. p.p.): € 509.810
3,04%
Yearly
€ 24.900
Direct available
Estimated mortgage
Indicative gross monthly cost
Based on annuity and 30 year term
Indicative net monthly cost
iDisclaimer: this mortgage calculation is a simplified indication based on general assumptions. No rights can be derived from the results shown. Calculated with 10-annual interest (zonder NHG), automatically determined based on the price limit € 470.000. Source: 10-jaars rente uit mortgage_rates (07-05-2026 03:45). For non-NHG, an 80% mortgage of the market value has been used in this indication.
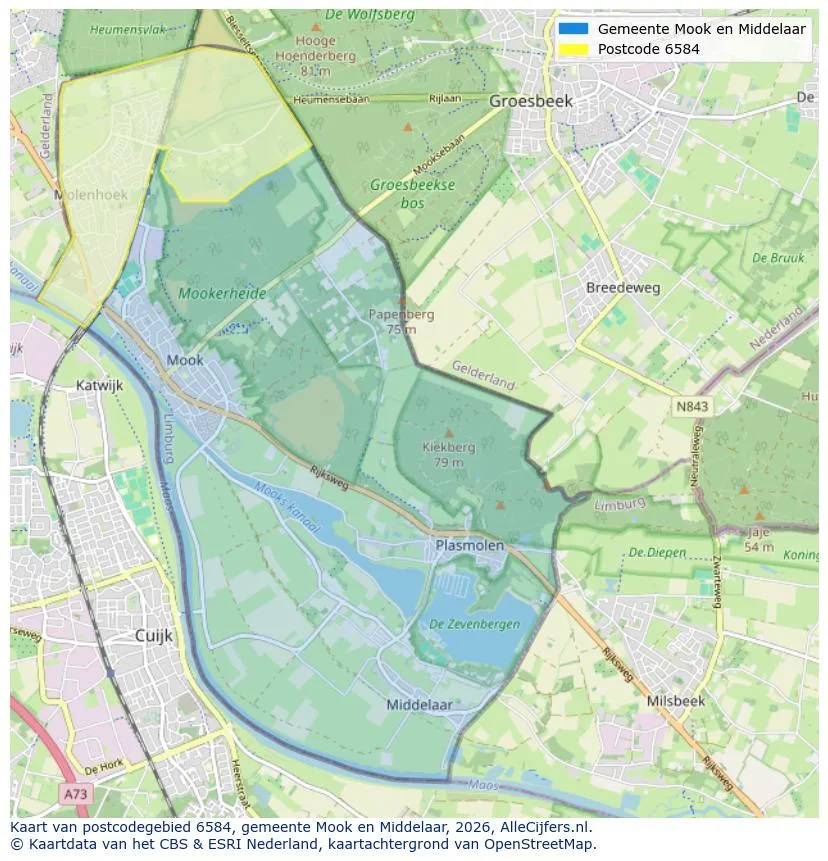
Spatial overview of the work area in Molenhoek
View current location data on residents, WOZ development, housing stock, energy consumption, business activity and safety in Molenhoek. In 2026 were there 3.771 residents. The average WOZ value in 2025 is EUR 449.000.
Residents
3.771
Last year: 2026
Average WOZ
EUR 449.000
Last year: 2025
Average income per person.
EUR 39.100
Source: AllNumbers
Crimes (current year)
113
Total registered
| Year | Residents |
|---|---|
| 2021 | 3.690 |
| 2022 | 3.735 |
| 2023 | 3.740 |
| 2024 | 3.725 |
| 2025 | 3.725 |
| 2026 | 3.771 |
| Year | Average WOZ |
|---|---|
| 2021 | EUR 324.000 |
| 2022 | EUR 347.000 |
| 2023 | EUR 419.000 |
| 2024 | EUR 422.000 |
| 2025 | EUR 449.000 |
Hoger
1.350
Praktisch
440
Middelbaar
1.000
Europa
275
Nederland
3.130
Buiten Europa
325
Label C
565
Label B
363
Label A
345
Label D
204
Label A++++
64
Label F
60
Label G
28
Label A+++
26
Label E
23
Label A+
6
Label A++
4
Label A+++++
0
| Year | Gas (m3) | Electricity (kWh) |
|---|---|---|
| 2020 | 1.460 | 3.120 |
| 2021 | 1.660 | 3.210 |
| 2022 | 1.300 | 2.930 |
| 2023 | 1.070 | 2.800 |
| 2024 | 1.000 | 2.840 |
Hoekwoning
Gas: 1.050 • Electricity: 2.640
Huurwoning
Gas: 810 • Electricity: 2.010
Koopwoning
Gas: 1.140 • Electricity: 3.040
Appartement
Gas: 710 • Electricity: 1.790
Tussenwoning
Gas: 900 • Electricity: 2.410
Vrijstaande woning
Gas: 1.450 • Electricity: 4.080
Twee-onder-één-kap woning
Gas: 1.190 • Electricity: 2.800
Total number of company establishments: 505
| Period | Crimes |
|---|---|
| jan 2026 | 6 |
| jul 2025 | 5 |
| jun 2025 | 5 |
| mei 2025 | 8 |
| mrt 2025 | 12 |
| mrt 2026 | 7 |
| nov 2024 | 7 |
| nov 2025 | 5 |
| okt 2024 | 10 |
| okt 2025 | 14 |
| sep 2024 | 12 |
| sep 2025 | 12 |
These figures give an indicative picture of safety trends in the living environment of Molenhoek.
Short answers based on current local statistics, handy for a quick comparison of the living environment.
Molenhoek telt in 2026 ongeveer 3.771 inwoners.
De gemiddelde WOZ-waarde in Molenhoek is in 2025 circa € 449.000.
Het gemiddelde inkomen per inwoner in Molenhoek ligt rond € 39.100 per jaar.
Voor het huidige jaar gaat het om ongeveer 113 geregistreerde misdrijven. Gebruik deze cijfers als indicatie en vergelijk trends per periode.
In Molenhoek komt vooral "Tussenwoningen" veel voor, met ongeveer 599 woningen.
View more homes in this location.

6584AB Molenhoek
€ 1.475.000 k.k.
€ 4.390/m²

6584BN Molenhoek
€ 395.000 k.k.
€ 3.038/m²

6584CZ Molenhoek
€ 615.000 k.k.
€ 3.968/m²

6584CE Molenhoek
€ 500.000 k.k.
€ 3.425/m²

6584AA Molenhoek
€ 265.000 k.k.
€ 5.761/m²

6584AZ Molenhoek
€ 295.000 k.k.
€ 3.882/m²

6584CL Molenhoek
€ 398.000 k.k.
€ 3.790/m²

6584BN Molenhoek
€ 500.000 k.k.
€ 4.132/m²
