
Residents
3.280
Last year: 2026
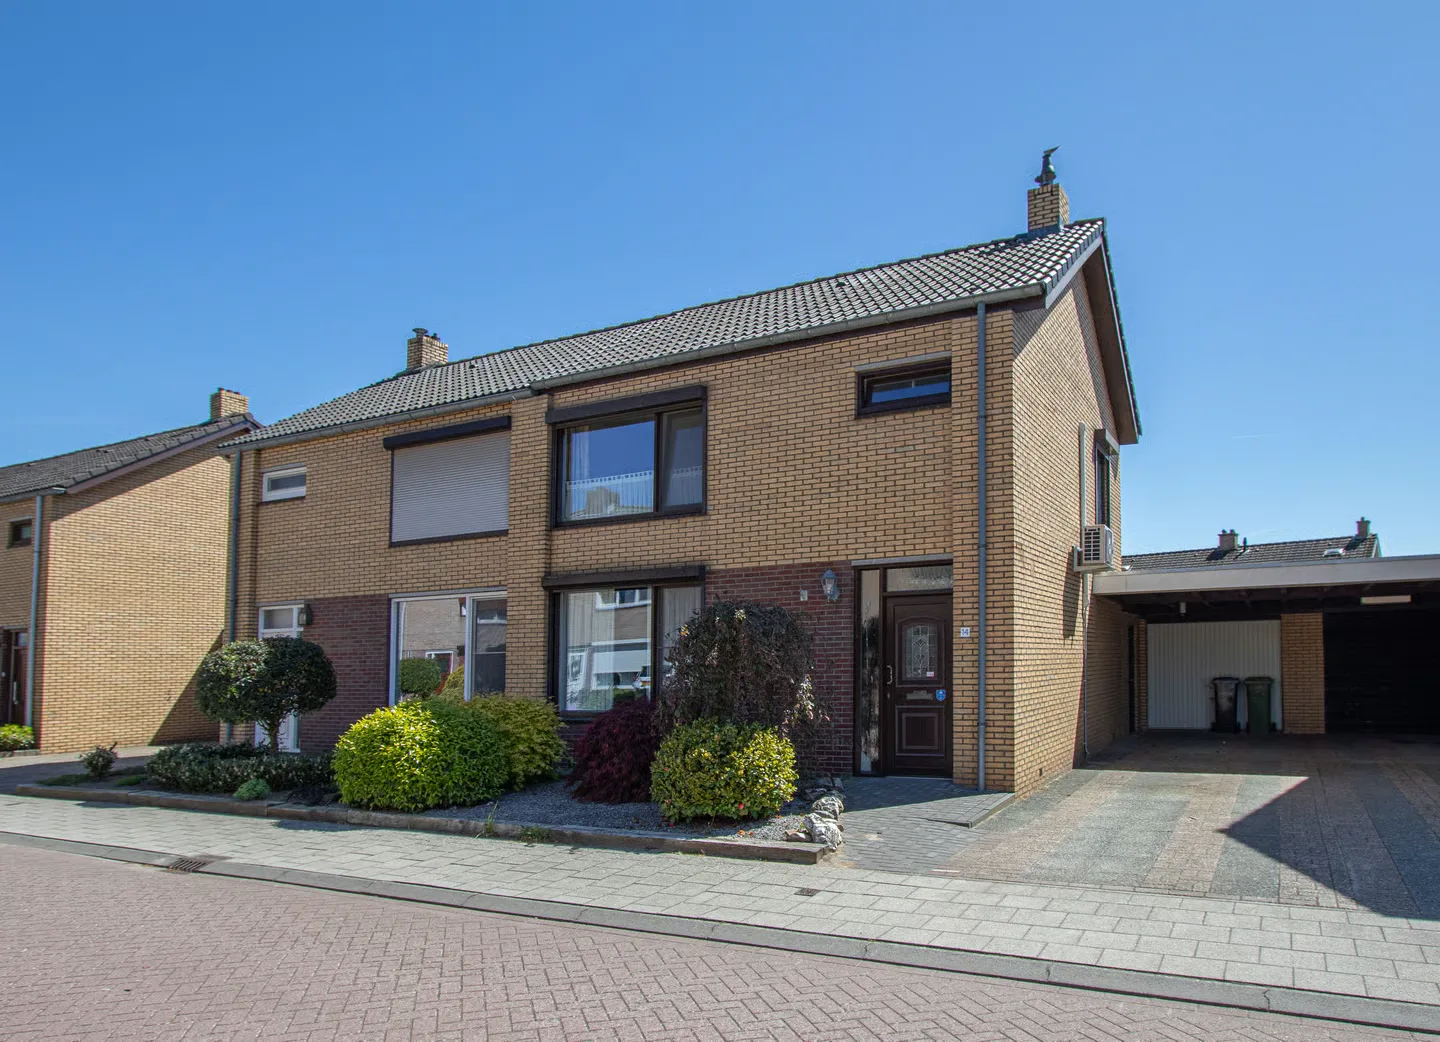
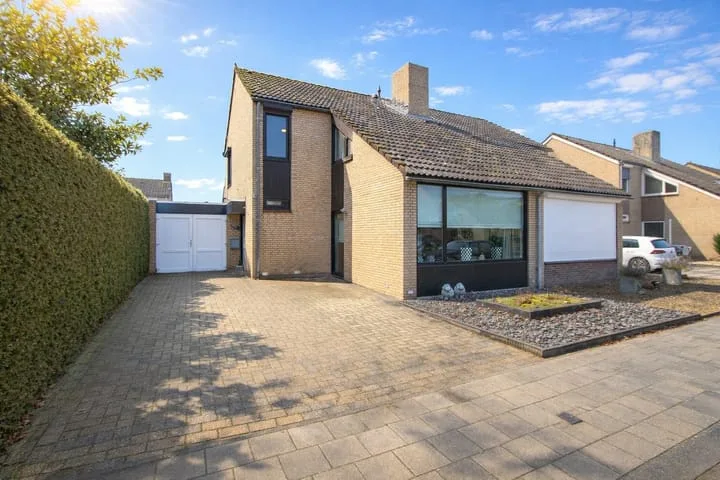
6086AV Neer • Limburg
€ 875.000 k.k.
Cost of copper (estimated): € 19.350
2% transfer tax (€ 17.500) + notary (€ 1.150) + valuation (€ 700)
Total incl. VAT: € 894.350
Purchase price /m²: € 2.887
For this property, no detailed description is available yet.
€ 875.000
Cost of copper (estimated): € 19.350
2% transfer tax (€ 17.500) + notary (€ 1.150) + valuation (€ 700)
Total purchase (incl. p.p.): € 894.350
3,21%
Yearly
€ 43.750
Direct available
Estimated mortgage
Indicative gross monthly cost
Based on annuity and 30 year term
Indicative net monthly cost
iDisclaimer: this mortgage calculation is a simplified indication based on general assumptions. No rights can be derived from the results shown. Calculated with 10-annual interest (zonder NHG), automatically determined based on the price limit € 470.000. Source: 10-jaars rente uit mortgage_rates (08-06-2026 03:45). For non-NHG, an 80% mortgage of the market value has been used in this indication.
3 inloopdouches, 2 jacuzzis, stoomcabine, toilet, en wastafelmeubel
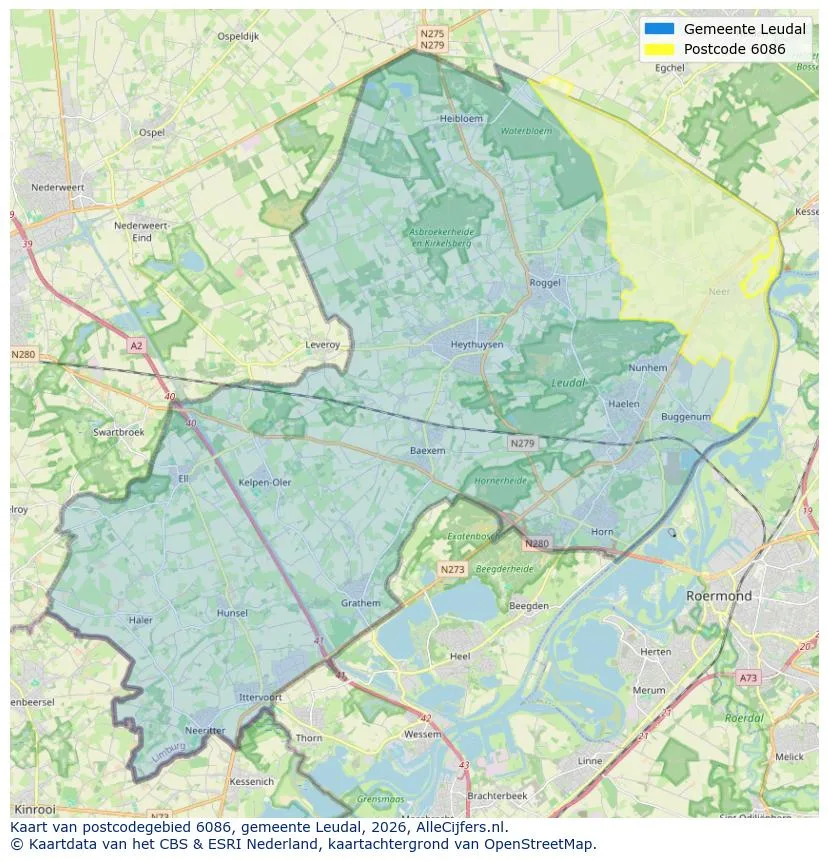
Discover where agents are active in Neer
View current location data on residents, WOZ development, housing stock, energy consumption, business activity and safety in Neer. In 2026 were there 3.280 residents. The average WOZ value in 2025 is EUR 361.000.
Residents
3.280
Last year: 2026
Average WOZ
EUR 361.000
Last year: 2025
Average income per person.
EUR 33.600
Source: AllNumbers
Crimes (current year)
77
Total registered
| Year | Residents |
|---|---|
| 2021 | 3.380 |
| 2022 | 3.365 |
| 2023 | 3.350 |
| 2024 | 3.330 |
| 2025 | 3.300 |
| 2026 | 3.280 |
| Year | Average WOZ |
|---|---|
| 2021 | EUR 269.000 |
| 2022 | EUR 284.000 |
| 2023 | EUR 331.000 |
| 2024 | EUR 334.000 |
| 2025 | EUR 361.000 |
Hoger
610
Praktisch
710
Middelbaar
1.220
Europa
215
Nederland
2.985
Buiten Europa
90
Label C
302
Label D
263
Label B
218
Label G
212
Label A
181
Label F
169
Label E
66
Label A++
9
Label A+
7
Label A+++
4
Label A++++
2
Label A+++++
2
| Year | Gas (m3) | Electricity (kWh) |
|---|---|---|
| 2020 | 1.450 | 3.410 |
| 2021 | 1.620 | 3.470 |
| 2022 | 1.240 | 3.250 |
| 2023 | 1.020 | 3.050 |
| 2024 | 1.000 | 3.160 |
Hoekwoning
Gas: 990 • Electricity: 2.800
Huurwoning
Gas: 860 • Electricity: 2.180
Koopwoning
Gas: 1.060 • Electricity: 3.260
Appartement
Gas: 680 • Electricity: 2.180
Tussenwoning
Gas: 890 • Electricity: 2.650
Vrijstaande woning
Gas: 1.210 • Electricity: 3.640
Twee-onder-één-kap woning
Gas: 1.000 • Electricity: 2.990
Total number of company establishments: 410
| Period | Crimes |
|---|---|
| jan 2026 | 1 |
| jul 2025 | 8 |
| jun 2025 | 3 |
| mei 2025 | 6 |
| mrt 2025 | 6 |
| mrt 2026 | 8 |
| nov 2024 | 6 |
| nov 2025 | 3 |
| okt 2024 | 7 |
| okt 2025 | 7 |
| sep 2024 | 9 |
| sep 2025 | 7 |
These figures give an indicative picture of safety trends in the living environment of Neer.
Short answers based on current local statistics, handy for a quick comparison of the living environment.
Neer telt in 2026 ongeveer 3.280 inwoners.
De gemiddelde WOZ-waarde in Neer is in 2025 circa € 361.000.
Het gemiddelde inkomen per inwoner in Neer ligt rond € 33.600 per jaar.
Voor het huidige jaar gaat het om ongeveer 77 geregistreerde misdrijven. Gebruik deze cijfers als indicatie en vergelijk trends per periode.
In Neer komt vooral "Vrijstaande woningen" veel voor, met ongeveer 604 woningen.
View more homes in this location.

6086CP Neer
€ 325.000 k.k.
€ 3.186/m²

6086BK Neer
€ 525.000 k.k.
€ 3.500/m²

6086AS Neer
€ 445.000 k.k.
€ 3.870/m²
6086BS Neer
€ 363.000 k.k.
€ 2.881/m²
6086CW Neer
€ 339.500 k.k.
6086EC Neer
€ 375.000 k.k.
€ 3.409/m²

6086AJ Neer
€ 419.000 k.k.
€ 3.612/m²
6086EC Neer
€ 349.500 k.k.
€ 3.149/m²
