Residents
1.250
Last year: 2026
6015AV Neeritter • Limburg
€ 350.000 k.k.
Cost of copper (estimated): € 8.850
2% transfer tax (€ 7.000) + notary (€ 1.150) + valuation (€ 700)
Total incl. VAT: € 358.850
Purchase price /m²: € 3.302
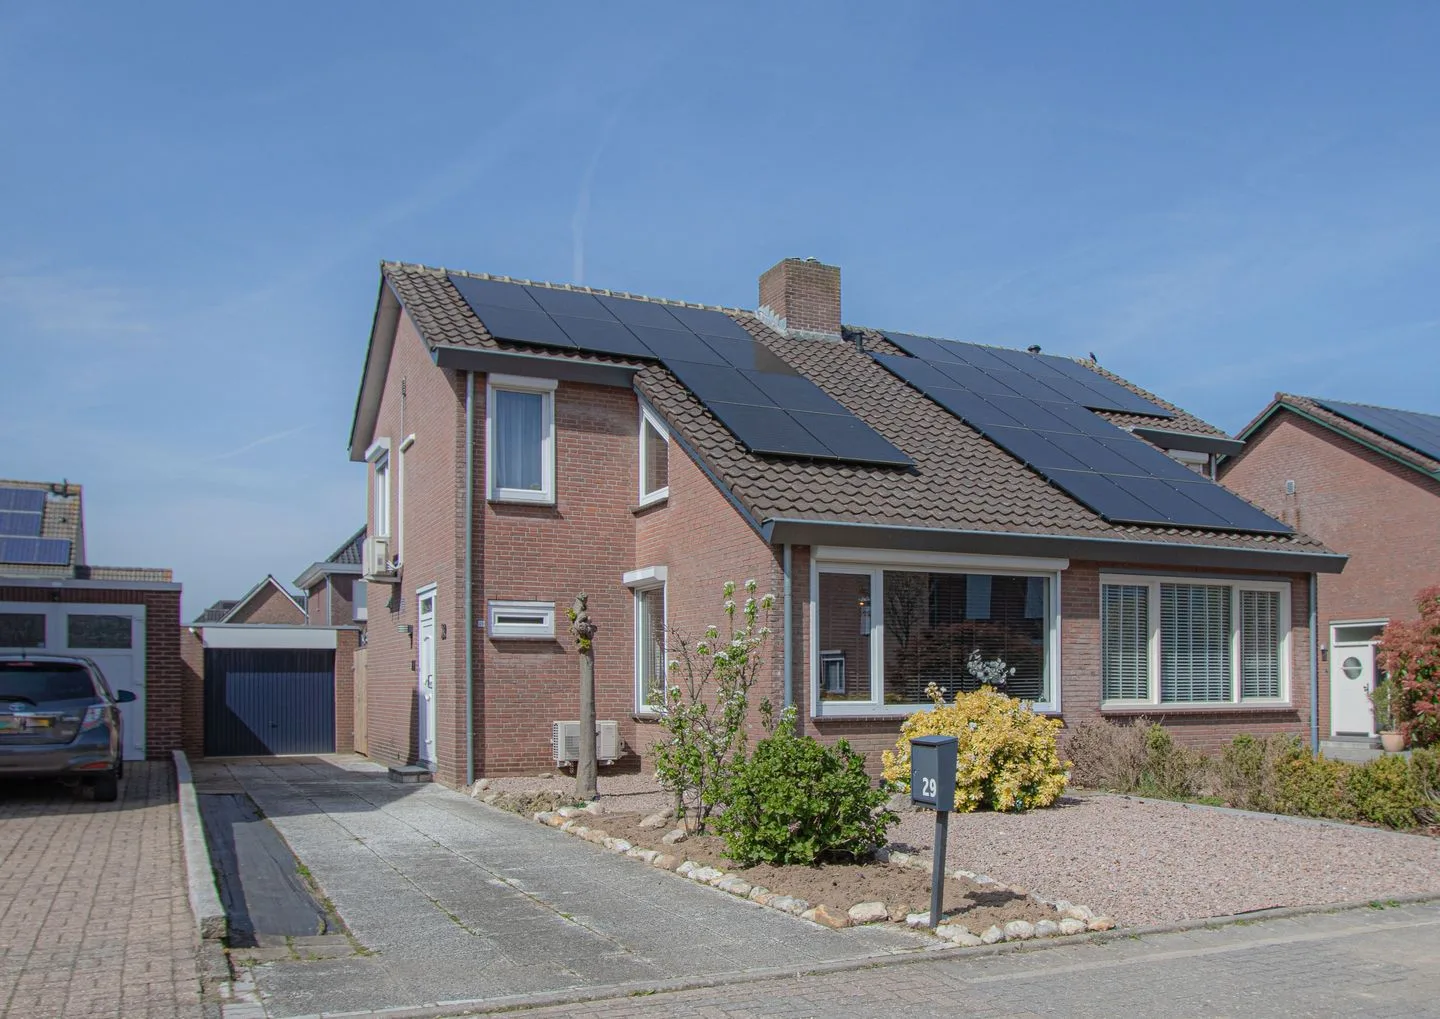
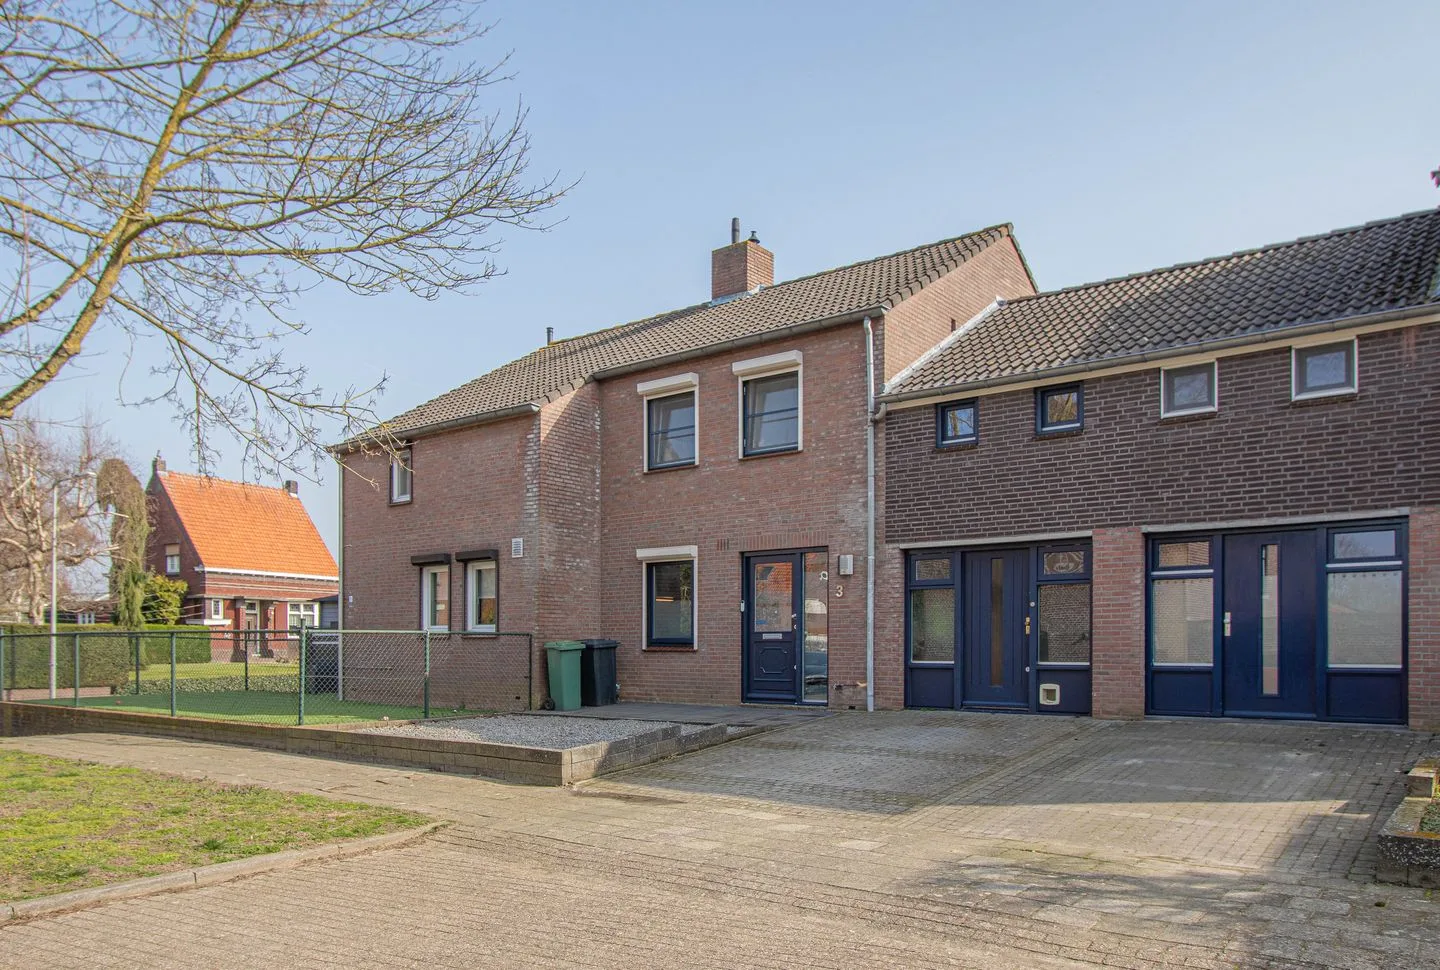
STARTERS en GEZINNEN OPGELET! Deze degelijk afgewerkte en instapklare 2-ONDER-1-KAP WONING met GARAGE in een rustige wijk in Neeritter staat te koop! Ben jij toe aan de volgende stap? Lees snel verder. Direct bij binnenkomst in de ontvangsthal bevindt zich een garderobe, een moderne (3x 25A) meterkast (2022) en een het toilet met fonteintje. Daarnaast geeft de hal toegang tot de lichte doorzon woonkamer voorzien van eigentijdse tegelvloer, strakke stucwerkwanden, airco (2023) en de trap naar de eerste verdieping. De ruime aanbouwkeuken is v.v. diverse inbouwapparatuur o.a. een vaatwasser, koelkast, combi magnetron (2020), Quooker (2013), inductiekookplaat v.v. krachtstroom (2022) en afzuigkap. Wat overigens super handig is het eilandblok waar je diverse voorraad kunt plaatsen alsook je prullenbak en hiermee creëer je eenvoudig extra werkruimte op het blad. Via de keuken is de praktische bijkeuken met witgoedaansluiting te bereiken en ideaal als provisieruimte met extra oven. Via de keuken en eetkamer heb je heerlijk zicht over de onlangs aangelegde achtertuin (2024), terras, graszode, groentetuintje en een steense schutting met diverse leibomen, welke zorgen voor optimale privacy en er is bovendien een eigen achterom middels de nieuwe tuindeur (2025). Verder is er nog een garage met stalen kantelpoort ideaal voor de doe-het-zelver of hobbyist en is er plek voor meerdere personenauto’s op de (extra) lange oprit. Middels de vaste trap in de woonkamer is de eerste verdieping bereikbaar met daaraan gelegen een complete badkamer en maar liefst vier ruime slaapvertrekken. De slaapvertrekken zijn allen voorzien van een eigentijdse laminaatvloer, structuur verfwanden en nog twee airco’s (2023) om te verwarmen en te verkoelen. Verder treft men hier de geheel betegelde badkamer met bad-/douche combinatie, 2e toilet, vaste wastafelmeubel met spiegelwand (2022) en radiator. De vlizotrap op de overloop geeft toegang tot de tweede verdieping, waarbij een mogelijkheid bestaat om een vaste trap te plaatsen. Thans in gebruik als royale bergzolder die is na geïsoleerd en hier hangt de cv-installatie (2011) en omvormer (Solar Edge). Verder is de woning v.v. kunststof kozijnen met isolerende beglazing en grotendeels rolluiken, waarbij er in 2023 nog 12 zonnepanelen zijn geplaatst, waarbij aantrekkelijk lage stookkosten voor een dergelijke woning. Deze prachtige woning ligt in een rustige buurt en wil je toch zien! Enthousiast na het zien van onze fotoreportage?! Neem dan even contact op met ons kantoor en reserveer een bezichtiging, onze makelaar laat het je namelijk graag zien… Indeling Begane grond Entree/hal – meterkast - toilet – woonkamer – aanbouwkeuken – eetkamer en praktische bijkeuken. Eerste verdieping Overloop met daaraan gelegen vier slaapvertrekken en de complete badkamer. Tweede verdieping Middels vlizotrap ruime bergzolder met cv-opstelling en omvormer bereikbaar. Mogelijkheid om vaste trap te realiseren voor nog meer ruimte. Tuin In 2024 nieuw aangelegde tuin met terras – graszode - groentetuin - leibomen - garage met stalen kantelpoort en optimale privacy met eigen achterom middels recent geplaatste tuindeur (2025). Lange oprit voor meerdere auto's en verzorgd aangelegde voortuin. Bijzonderheden - Definitief energielabel C, registratienummer 839231957, geldig tot 21-11-2029. Dit was voor het plaatsen van de zonnepanelen en airco; - Rondom kunststof kozijnen met isolerende beglazing en deels v.v. rolluiken; - De tweede verdieping beschikt over een houten dek en is na geïsoleerd; - de 12 zonnepanelen zijn eigendom van 2023 van 435 Wp van het merk Jinko; - Cv-installatie van het merk Nefit, bouwjaar ca. 2011, eigendom; - Boeiboorden zijn van Rockpanelen en daarmee onderhoudsvrij; - In de meterkast is een voorbereiding getroffen voor het plaatsen van een laadpaal; - De woning is voorzien van een kruipruimte; - Mede gezien de goede staat van onderhoud kunnen nieuwe bewoners met minimale investering hier intrekken; - Enthousiast na het zien van fotoreportage?! Het is echt de moeite waard om te komen bezichtigen; - Alle maten, plattegronden zijn indicatief, waaraan verder geen rechten ontleend kunnen worden; - Ter bescherming van de belangen van zowel koper als verkoper, wordt uitdrukkelijk gesteld dat een koopovereenkomst met betrekking tot deze onroerende zaak eerst dan tot stand komt nadat koper en verkoper de koopovereenkomst hebben getekend (“schriftelijkheidsvereiste”); - De termijn die wordt opgenomen voor eventuele (overeengekomen) ontbindende voorwaarden (financiering) is in de regel 6 weken na het sluiten van mondelinge overeenkomst; - De waarborgsom/bankgarantie is 10% van de koopsom. De koper dient deze 2 weken ná het vervallen van de ontbindende voorwaarden bij de desbetreffende notaris te deponeren; - Koper is te allen tijde gerechtigd voor eigen rekening een bouwkundige keuring te (laten) verrichten dan wel andere adviseurs te raadplegen teneinde een goed inzicht te verkrijgen over de staat van onderhoud.
€ 350.000
Cost of copper (estimated): € 8.850
2% transfer tax (€ 7.000) + notary (€ 1.150) + valuation (€ 700)
Total purchase (incl. p.p.): € 358.850
3,19%
Yearly
€ 17.500
Direct available
Estimated mortgage
Indicative gross monthly cost
Based on annuity and 30 year term
Indicative net monthly cost
iDisclaimer: this mortgage calculation is a simplified indication based on general assumptions. No rights can be derived from the results shown. Calculated with 10-annual interest (met NHG), automatically determined based on the price limit € 470.000. Source: 10-jaars rente uit mortgage_rates (16-06-2026 03:45).
Ligbad, toilet, en wastafel
Elektra
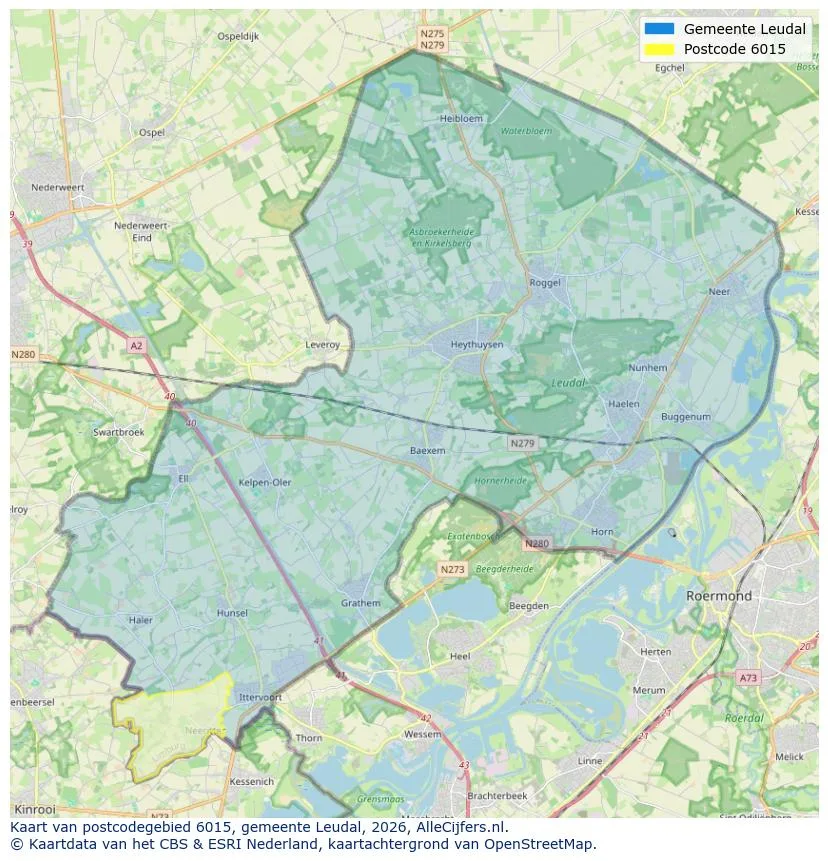
Spatial overview of the work area in Neeritter
View current location data on residents, WOZ development, housing stock, energy consumption, business activity and safety in Neeritter. In 2026 were there 1.250 residents. The average WOZ value in 2025 is EUR 341.000.
Residents
1.250
Last year: 2026
Average WOZ
EUR 341.000
Last year: 2025
Average income per person.
EUR 31.200
Source: AllNumbers
Crimes (current year)
14
Total registered
| Year | Residents |
|---|---|
| 2021 | 1.270 |
| 2022 | 1.260 |
| 2023 | 1.250 |
| 2024 | 1.250 |
| 2025 | 1.250 |
| 2026 | 1.250 |
| Year | Average WOZ |
|---|---|
| 2021 | EUR 249.000 |
| 2022 | EUR 264.000 |
| 2023 | EUR 314.000 |
| 2024 | EUR 316.000 |
| 2025 | EUR 341.000 |
Hoger
190
Praktisch
400
Middelbaar
400
Europa
190
Nederland
1.000
Buiten Europa
55
Label C
151
Label B
121
Label D
83
Label A
75
Label F
68
Label G
48
Label E
38
Label A++
2
Label A+
1
Label A+++
0
Label A++++
0
Label A+++++
0
| Year | Gas (m3) | Electricity (kWh) |
|---|---|---|
| 2020 | 1.450 | 3.300 |
| 2021 | 1.640 | 3.310 |
| 2022 | 1.300 | 3.130 |
| 2023 | 1.070 | 2.940 |
| 2024 | 1.040 | 3.080 |
Hoekwoning
Gas: 1.000 • Electricity: 2.800
Huurwoning
Gas: 900 • Electricity: 1.990
Koopwoning
Gas: 1.110 • Electricity: 3.200
Appartement
Gas: 830 • Electricity: 2.100
Tussenwoning
Gas: 910 • Electricity: 2.500
Vrijstaande woning
Gas: 1.340 • Electricity: 3.760
Twee-onder-één-kap woning
Gas: 950 • Electricity: 2.570
Total number of company establishments: 130
| Period | Crimes |
|---|---|
| jan 2026 | 0 |
| jul 2025 | 2 |
| jun 2025 | 2 |
| mei 2025 | 0 |
| mrt 2025 | 1 |
| mrt 2026 | 1 |
| nov 2024 | 1 |
| nov 2025 | 1 |
| okt 2024 | 2 |
| okt 2025 | 1 |
| sep 2024 | 3 |
| sep 2025 | 2 |
These figures give an indicative picture of safety trends in the living environment of Neeritter.
Short answers based on current local statistics, handy for a quick comparison of the living environment.
Neeritter telt in 2026 ongeveer 1.250 inwoners.
De gemiddelde WOZ-waarde in Neeritter is in 2025 circa € 341.000.
Het gemiddelde inkomen per inwoner in Neeritter ligt rond € 31.200 per jaar.
Voor het huidige jaar gaat het om ongeveer 14 geregistreerde misdrijven. Gebruik deze cijfers als indicatie en vergelijk trends per periode.
In Neeritter komt vooral "Vrijstaande woningen" veel voor, met ongeveer 203 woningen.
View more homes in this location.
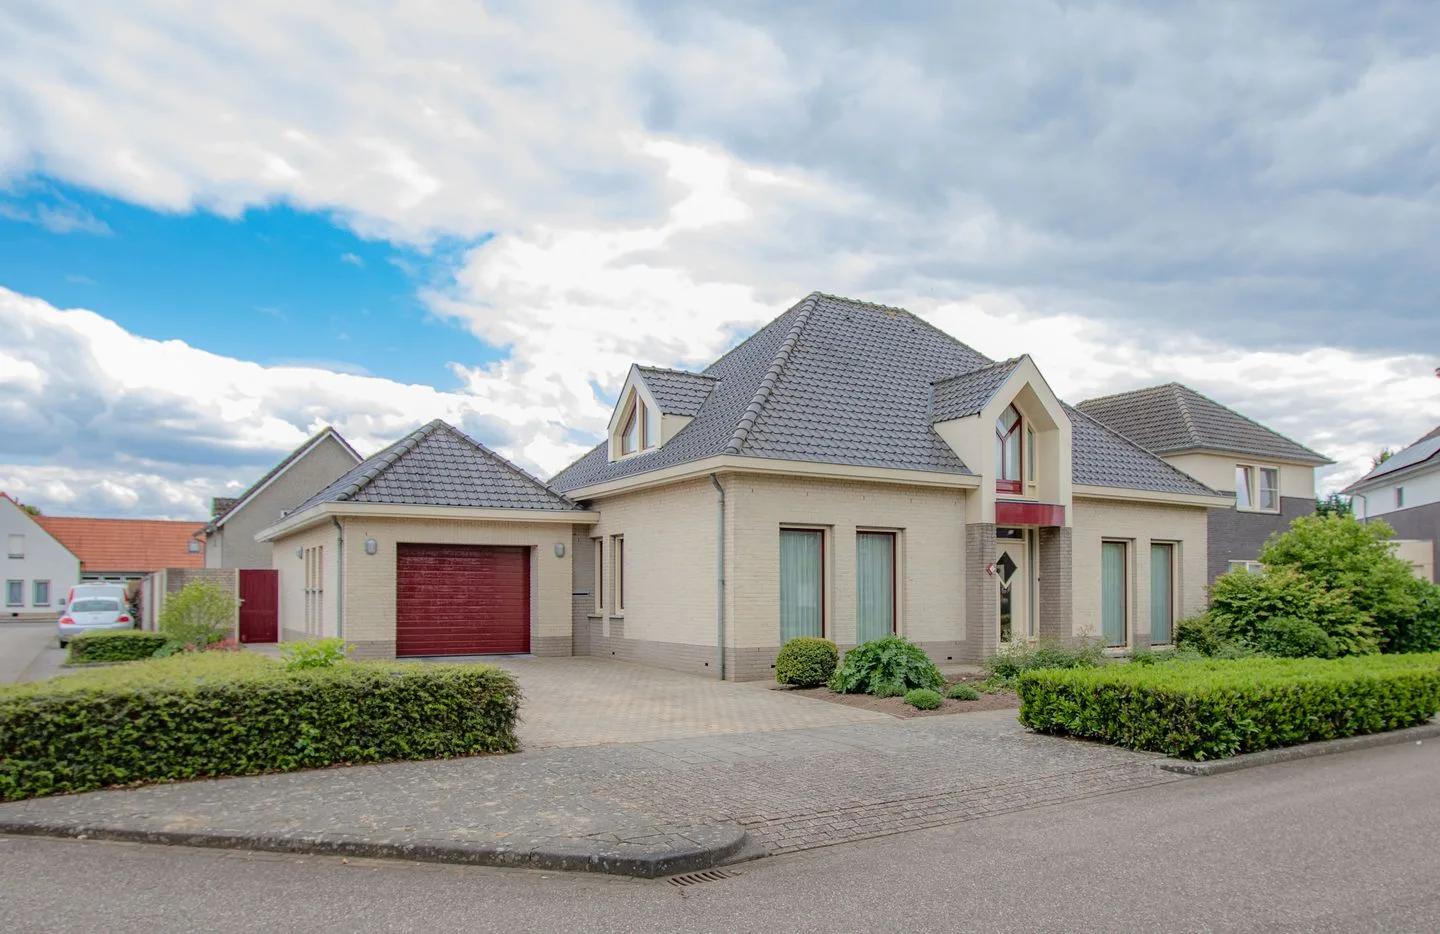
6015BT Neeritter
€ 625.000 k.k.
€ 4.085/m²
6015RC Neeritter
€ 285.000 k.k.
€ 2.007/m²
6015AE Neeritter
€ 395.000 k.k.

6015RD Neeritter
€ 898.000 k.k.
6015BZ Neeritter
€ 319.500 k.k.
€ 2.640/m²

6015AP Neeritter
€ 369.000 k.k.
€ 2.617/m²

6015AL Neeritter
€ 379.500 k.k.
€ 2.513/m²

6015BA Neeritter
€ 310.000 k.k.
€ 3.604/m²
