Residents
4.480
Last year: 2025
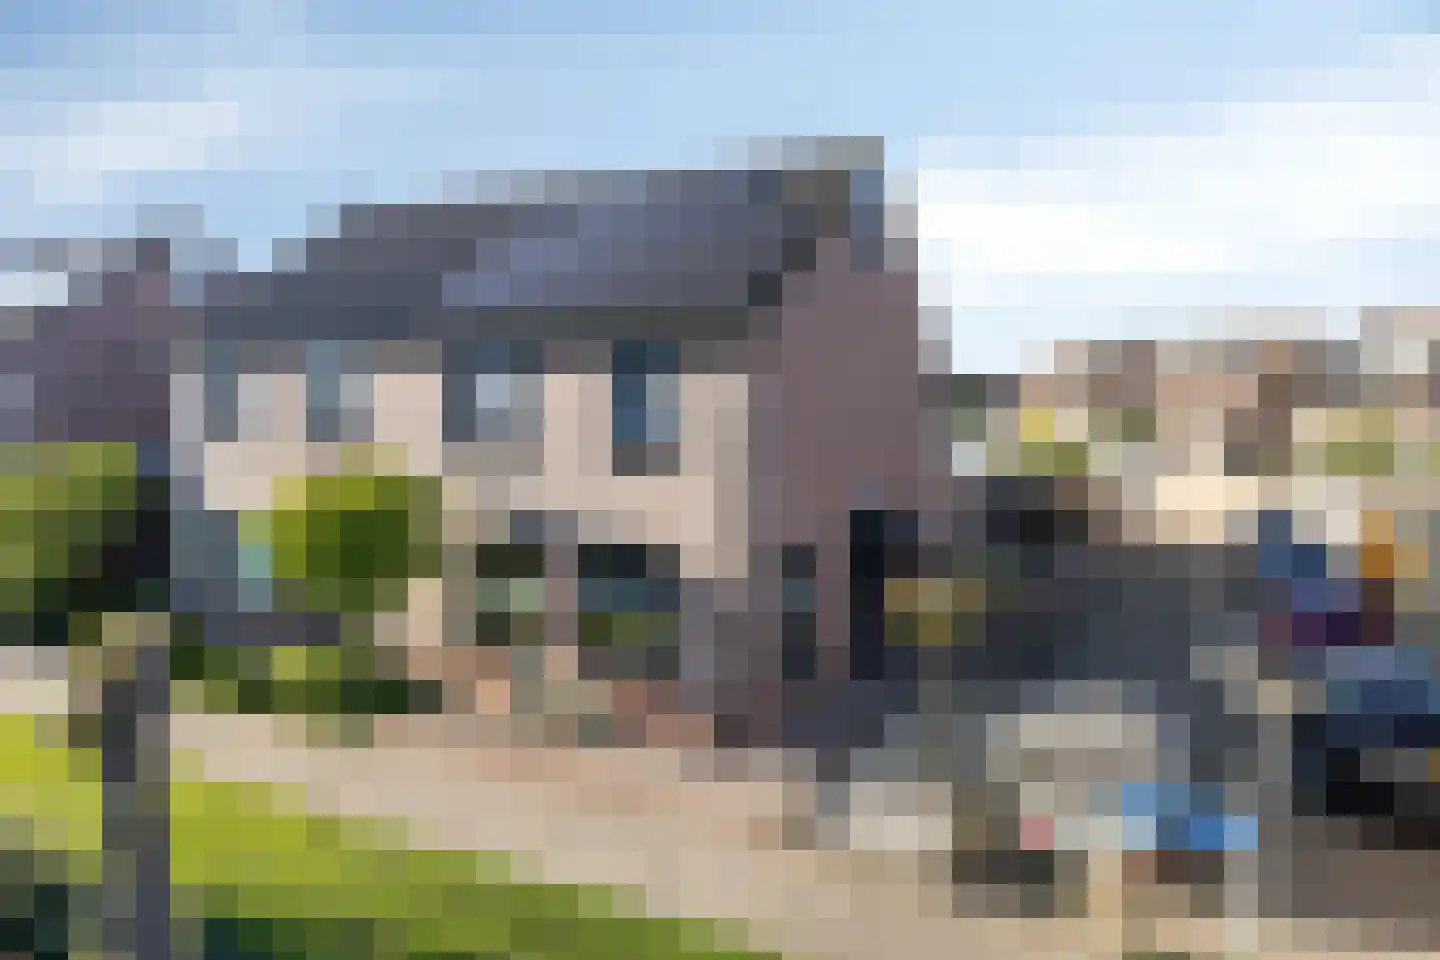
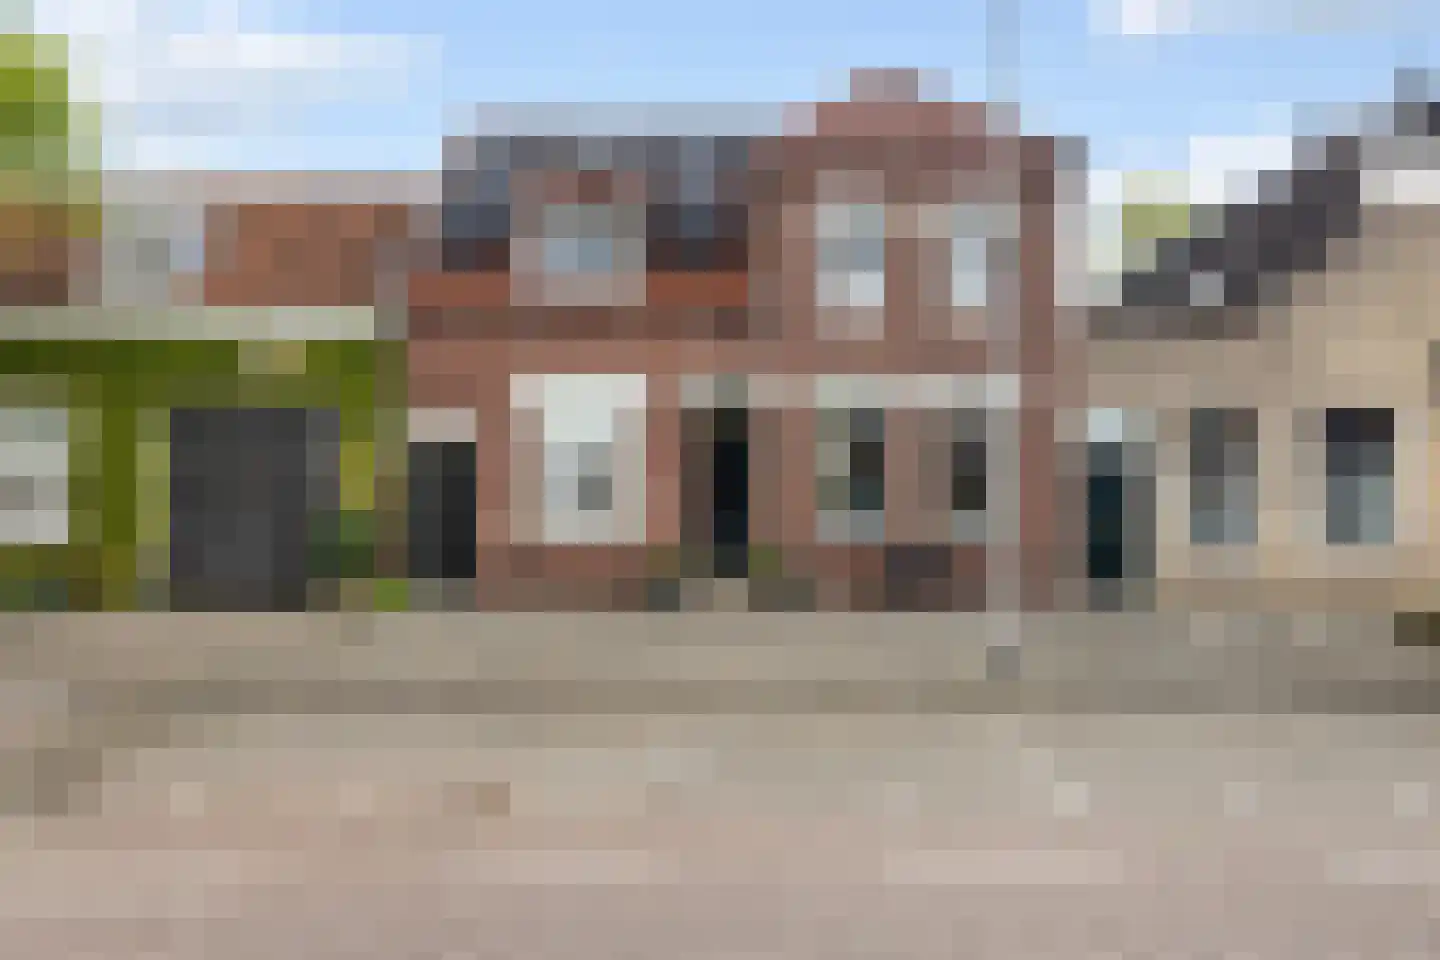
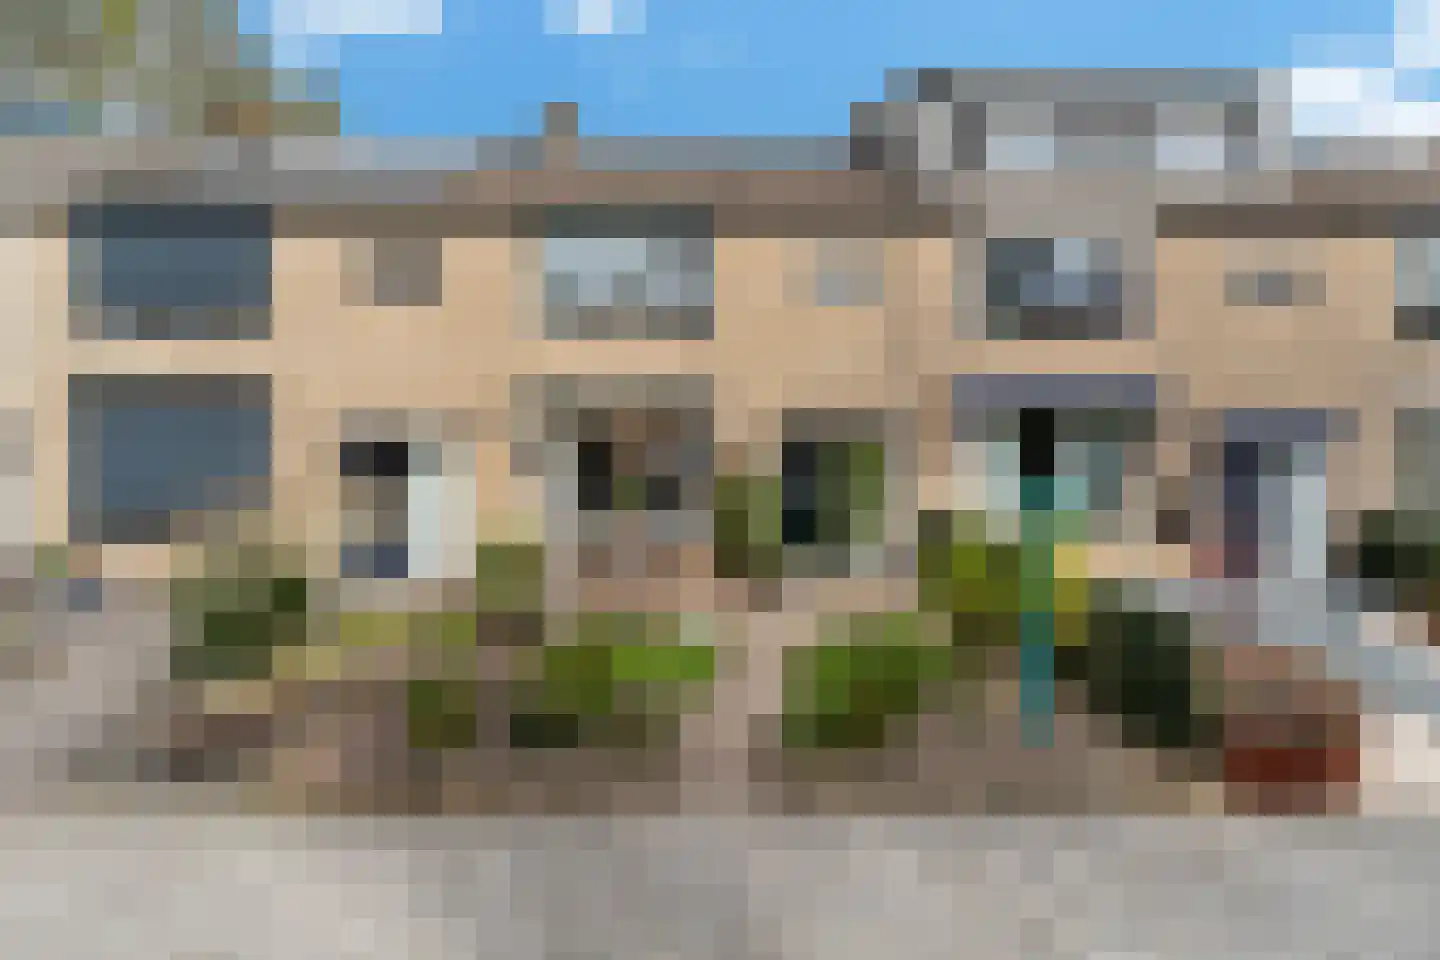
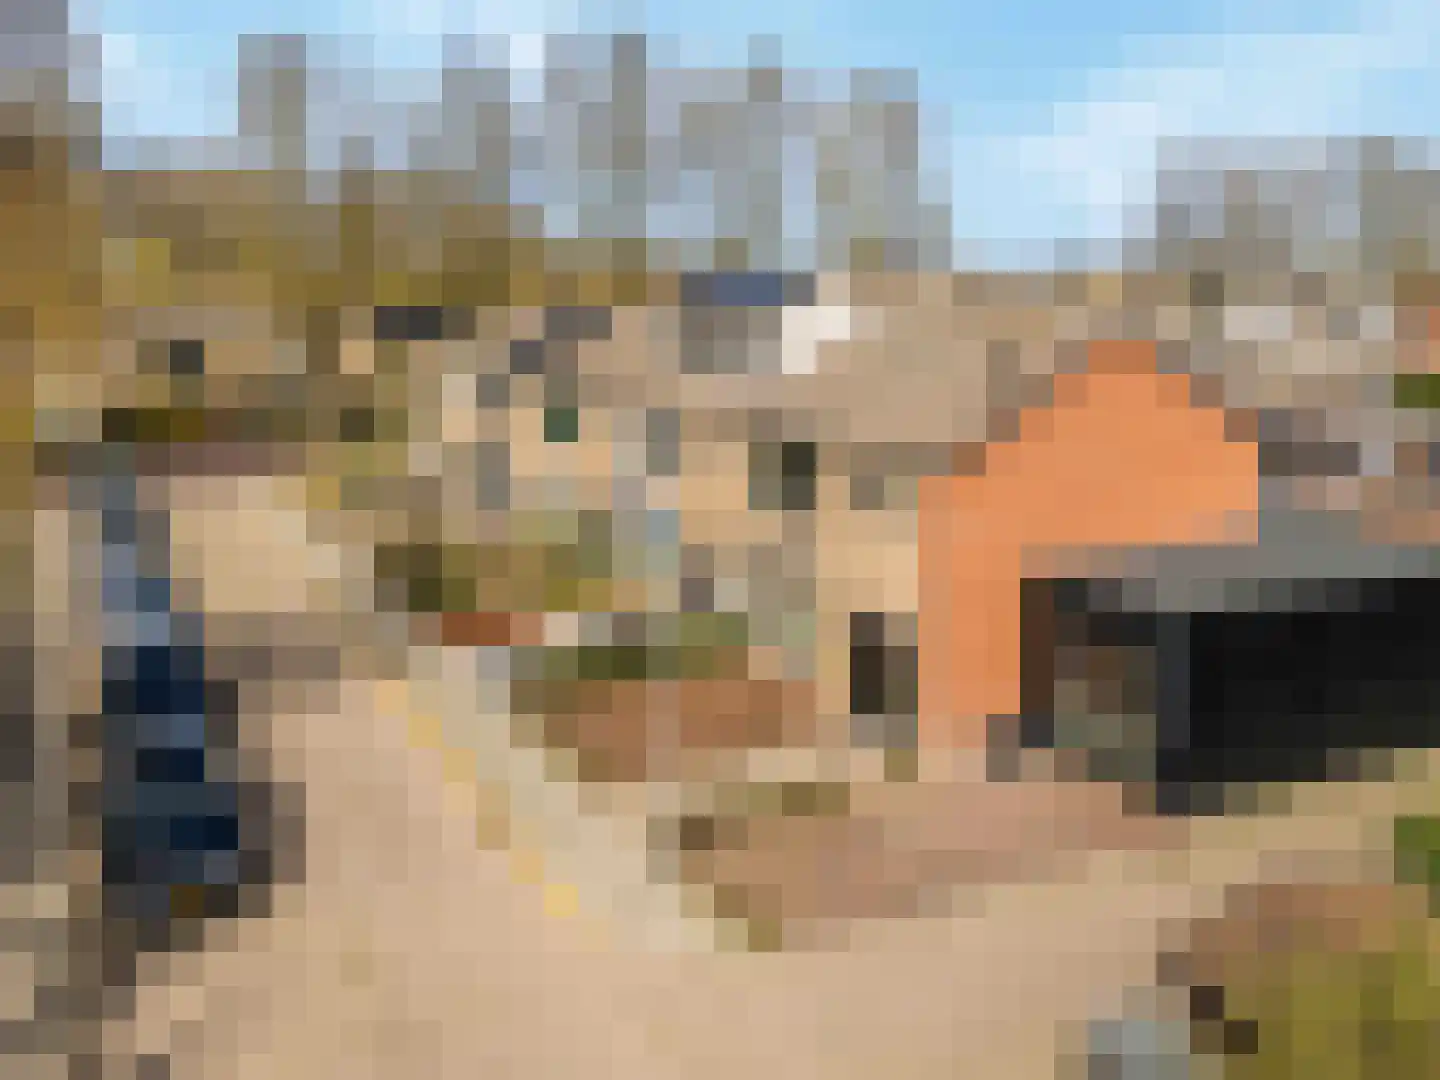
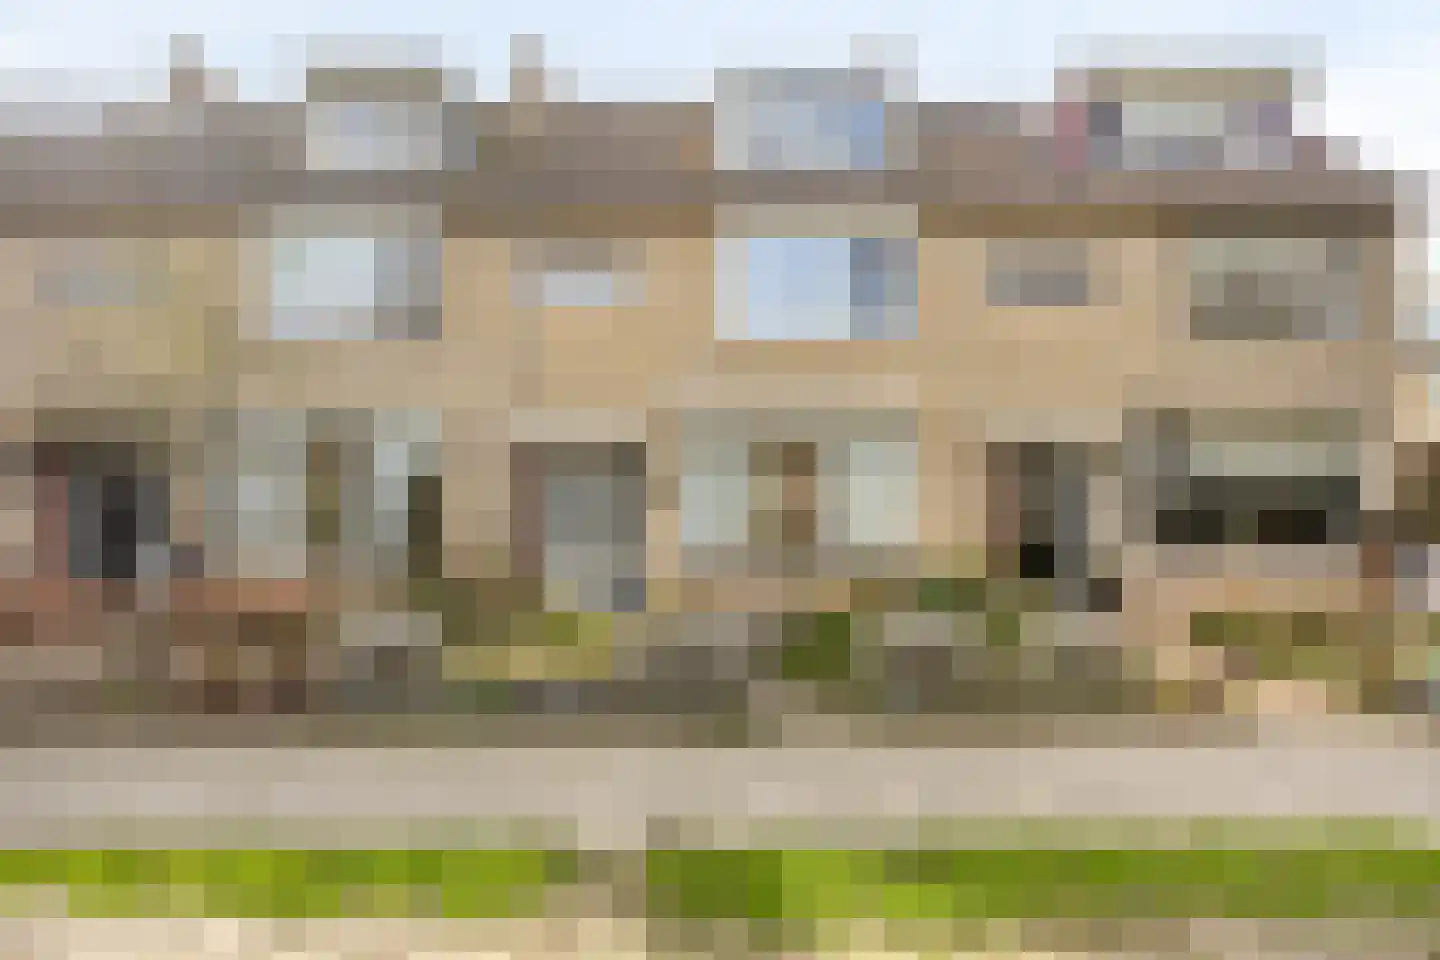
3264TE Nieuw-Beijerland • Zuid-Holland
€ 650.000 k.k.
Cost of copper (estimated): € 14.850
2% transfer tax (€ 13.000) + notary (€ 1.150) + valuation (€ 700)
Total incl. VAT: € 664.850
For this property, no detailed description is available yet.
€ 650.000
Cost of copper (estimated): € 14.850
2% transfer tax (€ 13.000) + notary (€ 1.150) + valuation (€ 700)
Total purchase (incl. p.p.): € 664.850
3,04%
Yearly
€ 32.500
Direct available
Estimated mortgage
Indicative gross monthly cost
Based on annuity and 30 year term
Indicative net monthly cost
iDisclaimer: this mortgage calculation is a simplified indication based on general assumptions. No rights can be derived from the results shown. Calculated with 10-annual interest (zonder NHG), automatically determined based on the price limit € 470.000. Source: 10-jaars rente uit mortgage_rates (10-05-2026 03:45). For non-NHG, an 80% mortgage of the market value has been used in this indication.
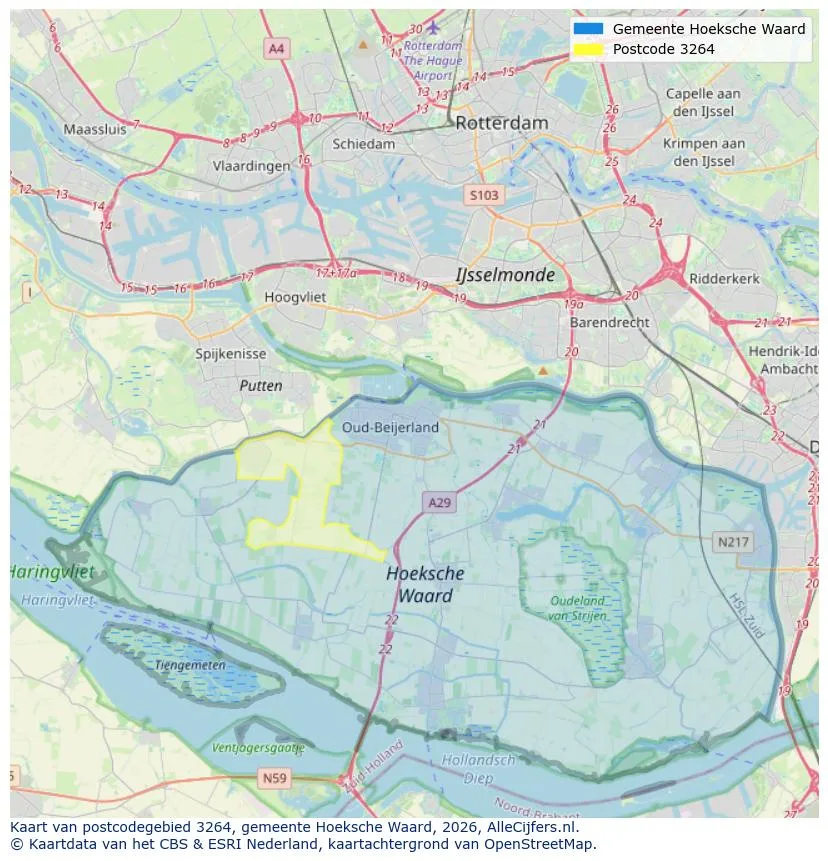
Explore Nieuw-Beijerland and the surrounding areas
View current location data on residents, WOZ development, housing stock, energy consumption, business activity and safety in Nieuw-Beijerland. In 2025 were there 4.480 residents. The average WOZ value in 2025 is EUR 412.000.
Residents
4.480
Last year: 2025
Average WOZ
EUR 412.000
Last year: 2025
Average income per person.
EUR 35.300
Source: AllNumbers
Crimes (current year)
98
Total registered
| Year | Residents |
|---|---|
| 2021 | 4.190 |
| 2022 | 4.285 |
| 2023 | 4.410 |
| 2024 | 4.475 |
| 2025 | 4.480 |
| Year | Average WOZ |
|---|---|
| 2021 | EUR 286.000 |
| 2022 | EUR 320.000 |
| 2023 | EUR 379.000 |
| 2024 | EUR 407.000 |
| 2025 | EUR 412.000 |
Hoger
800
Praktisch
800
Middelbaar
1.570
Europa
135
Nederland
4.090
Buiten Europa
255
Label A
445
Label C
400
Label B
276
Label D
196
Label G
130
Label A++++
83
Label F
63
Label E
44
Label A+
36
Label A+++
24
Label A++
5
Label A+++++
0
| Year | Gas (m3) | Electricity (kWh) |
|---|---|---|
| 2020 | 1.270 | 3.150 |
| 2021 | 1.400 | 3.240 |
| 2022 | 1.060 | 3.080 |
| 2023 | 870 | 2.960 |
| 2024 | 820 | 3.080 |
Hoekwoning
Gas: 810 • Electricity: 2.680
Huurwoning
Gas: 730 • Electricity: 1.960
Koopwoning
Gas: 900 • Electricity: 3.190
Appartement
Gas: 660 • Electricity: 2.390
Tussenwoning
Gas: 720 • Electricity: 2.400
Vrijstaande woning
Gas: 1.230 • Electricity: 4.180
Twee-onder-één-kap woning
Gas: 910 • Electricity: 3.280
Total number of company establishments: 485
| Period | Crimes |
|---|---|
| jan 2025 | 10 |
| jan 2026 | 6 |
| jul 2025 | 8 |
| jun 2025 | 8 |
| mei 2025 | 12 |
| mrt 2025 | 8 |
| nov 2024 | 4 |
| nov 2025 | 7 |
| okt 2024 | 3 |
| okt 2025 | 6 |
| sep 2024 | 6 |
| sep 2025 | 4 |
These figures give an indicative picture of safety trends in the living environment of Nieuw-Beijerland.
Short answers based on current local statistics, handy for a quick comparison of the living environment.
Nieuw-Beijerland telt in 2025 ongeveer 4.480 inwoners.
De gemiddelde WOZ-waarde in Nieuw-Beijerland is in 2025 circa € 412.000.
Het gemiddelde inkomen per inwoner in Nieuw-Beijerland ligt rond € 35.300 per jaar.
Voor het huidige jaar gaat het om ongeveer 98 geregistreerde misdrijven. Gebruik deze cijfers als indicatie en vergelijk trends per periode.
In Nieuw-Beijerland komt vooral "Tussenwoningen" veel voor, met ongeveer 625 woningen.
View more homes in this location.
3264AW Nieuw-Beijerland
€ 550.000 k.k.
€ 3.819/m²

3264PK Nieuw-Beijerland
€ 550.000 k.k.
€ 4.167/m²
3264VC Nieuw-Beijerland
€ 369.500 k.k.
€ 3.213/m²

3264AA Nieuw-Beijerland
€ 495.000 k.k.
€ 5.156/m²

3264LR Nieuw-Beijerland
€ 599.000 k.k.
€ 4.309/m²

3264AV Nieuw-Beijerland
€ 1.600.000 k.k.
€ 4.267/m²
3264VC Nieuw-Beijerland
€ 600.000 k.k.
€ 3.727/m²
3264XK Nieuw-Beijerland
€ 437.500 k.k.
€ 3.125/m²
