Residents
466
Last year: 2025

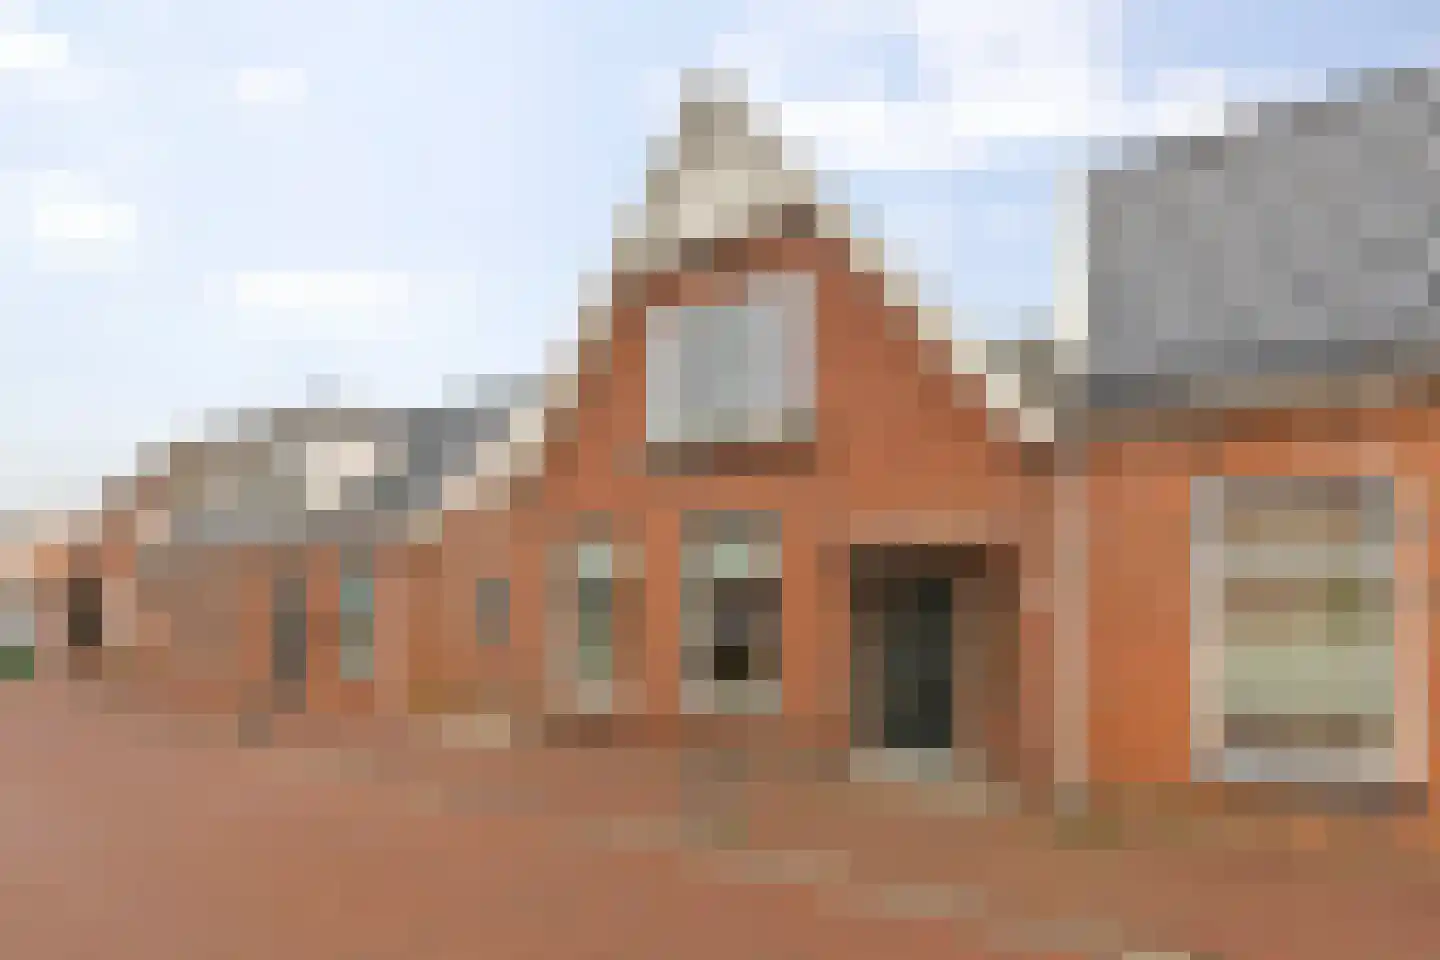
9842PC Niezijl • Groningen
€ 269.000 k.k.
Cost of copper (estimated): € 7.230
2% transfer tax (€ 5.380) + notary (€ 1.150) + valuation (€ 700)
Total incl. VAT: € 276.230
For this property, no detailed description is available yet.
€ 269.000
Cost of copper (estimated): € 7.230
2% transfer tax (€ 5.380) + notary (€ 1.150) + valuation (€ 700)
Total purchase (incl. p.p.): € 276.230
2,78%
Yearly
€ 13.450
Direct available
Estimated mortgage
Indicative gross monthly cost
Based on annuity and 30 year term
Indicative net monthly cost
iDisclaimer: this mortgage calculation is a simplified indication based on general assumptions. No rights can be derived from the results shown. Calculated with 10-annual interest (met NHG), automatically determined based on the price limit € 470.000. Source: 10-jaars rente uit mortgage_rates (08-05-2026 03:45).
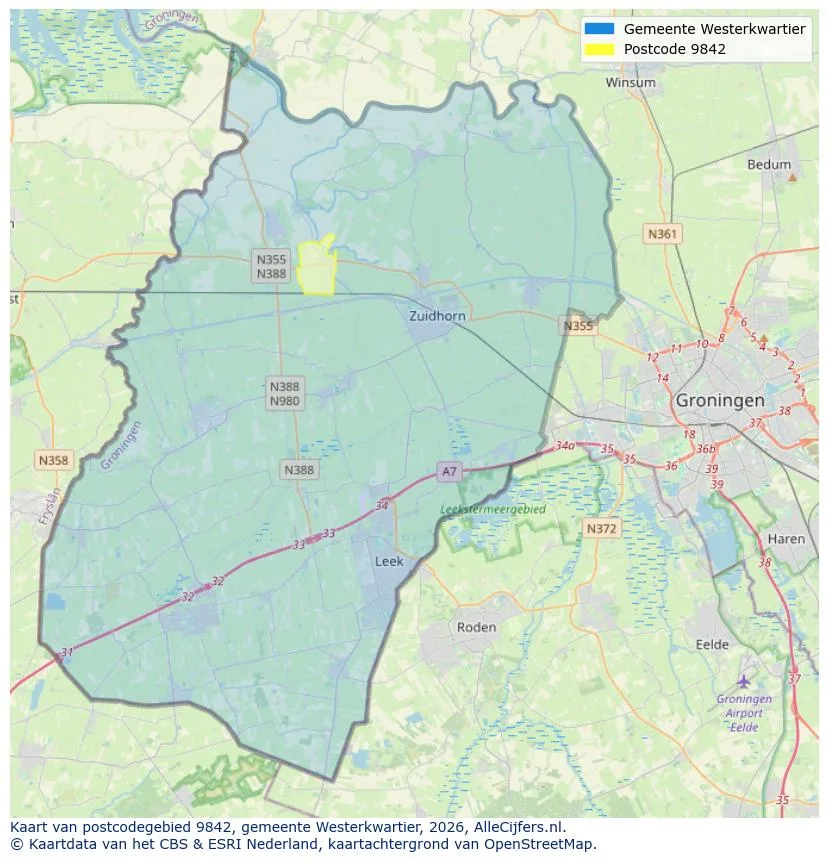
Explore Niezijl and the surrounding areas
View current location data on residents, WOZ development, housing stock, energy consumption, business activity and safety in Niezijl. In 2025 were there 466 residents. The average WOZ value in 2025 is EUR 246.259.
Residents
466
Last year: 2025
Average WOZ
EUR 246.259
Last year: 2025
Average income per person.
EUR 29.217
Source: AllNumbers
Crimes (current year)
3
Total registered
| Year | Residents |
|---|---|
| 2021 | 458 |
| 2022 | 458 |
| 2023 | 472 |
| 2024 | 476 |
| 2025 | 466 |
| Year | Average WOZ |
|---|---|
| 2021 | EUR 178.710 |
| 2022 | EUR 193.716 |
| 2023 | EUR 219.679 |
| 2024 | EUR 221.593 |
| 2025 | EUR 246.259 |
Hoger
87
Praktisch
50
Middelbaar
182
Europa
16
Nederland
415
Buiten Europa
35
Label G
52
Label B
41
Label C
41
Label D
33
Label F
16
Label A
14
Label E
13
Label A+
0
Label A++
0
Label A+++
0
Label A++++
0
Label A+++++
0
| Year | Gas (m3) | Electricity (kWh) |
|---|---|---|
| 2020 | 1.572 | 2.702 |
| 2021 | 1.852 | 2.755 |
| 2022 | 1.425 | 2.499 |
| 2023 | 1.196 | 2.425 |
| 2024 | 1.162 | 2.500 |
Hoekwoning
Gas: 1.084 • Electricity: 2.094
Huurwoning
Gas: 988 • Electricity: 1.685
Koopwoning
Gas: 1.241 • Electricity: 2.568
Appartement
Gas: 51 • Electricity: 104
Tussenwoning
Gas: 897 • Electricity: 1.505
Vrijstaande woning
Gas: 1.319 • Electricity: 2.882
Twee-onder-één-kap woning
Gas: 1.143 • Electricity: 1.985
Total number of company establishments: 56
| Period | Crimes |
|---|---|
| jan 2025 | 1 |
| jan 2026 | 1 |
| jul 2025 | 0 |
| jun 2025 | 0 |
| mei 2025 | 1 |
| mrt 2025 | 1 |
| nov 2024 | 0 |
| nov 2025 | 0 |
| okt 2024 | 1 |
| okt 2025 | 0 |
| sep 2024 | 1 |
| sep 2025 | 0 |
These figures give an indicative picture of safety trends in the living environment of Niezijl.
Short answers based on current local statistics, handy for a quick comparison of the living environment.
Niezijl telt in 2025 ongeveer 466 inwoners.
De gemiddelde WOZ-waarde in Niezijl is in 2025 circa € 246.259.
Het gemiddelde inkomen per inwoner in Niezijl ligt rond € 29.217 per jaar.
Voor het huidige jaar gaat het om ongeveer 3 geregistreerde misdrijven. Gebruik deze cijfers als indicatie en vergelijk trends per periode.
In Niezijl komt vooral "Vrijstaande woningen" veel voor, met ongeveer 94 woningen.
View more homes in this location.

9842PL Niezijl
€ 495.000 k.k.
€ 1.889/m²

9842PC Niezijl
€ 295.000 k.k.
€ 2.007/m²

9842PE Niezijl
€ 350.000 k.k.
€ 3.571/m²

9842PC Niezijl
€ 275.000 k.k.
€ 2.148/m²

9842PW Niezijl
€ 200.000 k.k.
€ 2.564/m²

9842PK Niezijl
€ 217.500 k.k.
€ 2.500/m²

9842PH Niezijl
€ 175.000 k.k.
€ 2.822/m²

9842PS Niezijl
€ 225.000 k.k.
€ 1.654/m²
