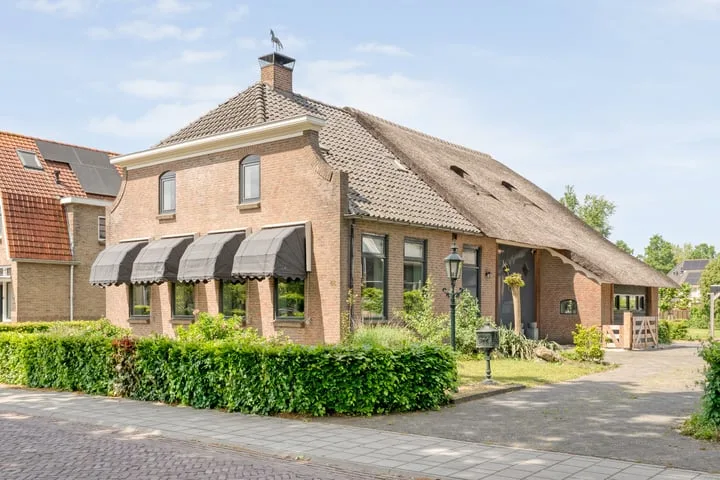
- Sold
Binnenveen 26
7948DA Nijeveen
€ 629.000 k.k.
€ 4.460/m²
- Living area
- 141 m²
- Land area
- 536 m²
- Bedrooms
- 4
View 36 sold houses in Nijeveen
Type to search. Use arrow down and arrow up to navigate through results and press Enter to open.
Hidden search suggestions.
Compare sold homes in Nijeveen or view the current offering in this location directly.
On this page you will find recently sold homes in Nijeveen. Use this overview to better estimate selling prices, popular neighborhoods, and the local housing supply before you choose a real estate agent. Also view the current housing supply with 57 houses in Nijeveen.
7948DA Nijeveen
€ 629.000 k.k.
€ 4.460/m²
7948LV Nijeveen
€ 1.050.000 k.k.
€ 4.200/m²
7948LT Nijeveen
€ 575.000 k.k.
€ 4.527/m²
7948LG Nijeveen
€ 950.000 k.k.
€ 3.740/m²
7948AR Nijeveen
€ 347.000 k.k.
€ 2.965/m²
7948BM Nijeveen
€ 869.000 k.k.
€ 3.794/m²
7948LW Nijeveen
€ 625.000 k.k.
€ 5.630/m²
7948BL Nijeveen
€ 698.000 k.k.
€ 2.848/m²
Bekijk recente verkopen en ontvang gratis offertes van lokale verkoopmakelaars in Nijeveen.
Zelf je woning verkopen in Nijeveen? Vergelijk verkoopmakelaars in Nijeveen of bekijk de beste verkoopmakelaars in Nijeveen als referentie bij jouw keuze.
Makelaars maken scherpere voorstellen als ze weten dat je vergelijkt — vraag offertes aan voor verkoop of aankoop.
Short answers about housing prices, sold homes and comparing real estate agents in Nijeveen.
The costs of a real estate agent in Nijeveen vary per office, property type and sales approach. Therefore, compare multiple quotes and also look at the real estate agents in Nijeveen to better compare rates, presentation and local experience.
On this page we currently show 36 sold houses in Nijeveen from our selection. This helps you to better assess recent transactions and the local housing market.
Houses sold in Nijeveen give insight into asking prices, house types and neighborhoods where recent transactions have taken place. Compare this also with the current housing stock in Nijeveen to better understand the market.
You can use sold homes as a first market indication, but a local real estate agent can better take into account finishing, location, maintenance and current demand in Nijeveen.
Vergelijk makelaars in Nijeveen op lokale verkoopervaring, reviews, verwachte opbrengst, courtage en marketingaanpak. Bekijk verkoopmakelaars in Nijeveen of de top 10 makelaars in Nijeveen om snel sterke kantoren te ontdekken.
View current location data on residents, WOZ development, housing stock, energy consumption, business activity and safety in Nijeveen. In 2026 were there 4.039 residents. The average WOZ value in 2025 is EUR 375.000.
These figures help to better assess and compare the housing stock in Nijeveen with recent sold homes. Orient yourself then on suitable top real estate agents in Nijeveen for sales advice in this region.
Residents
4.039
Last year: 2026
Average WOZ
EUR 375.000
Last year: 2025
Average income per person.
EUR 33.300
Source: AllNumbers
Crimes (current year)
45
Total registered
| Year | Residents |
|---|---|
| 2021 | 3.960 |
| 2022 | 3.995 |
| 2023 | 4.040 |
| 2024 | 4.035 |
| 2025 | 4.060 |
| 2026 | 4.039 |
| Year | Average WOZ |
|---|---|
| 2021 | EUR 278.000 |
| 2022 | EUR 303.000 |
| 2023 | EUR 345.000 |
| 2024 | EUR 358.000 |
| 2025 | EUR 375.000 |
Hoger
820
Praktisch
740
Middelbaar
1.460
Europa
135
Nederland
3.780
Buiten Europa
145
Label A
445
Label B
343
Label C
342
Label D
197
Label G
181
Label F
74
Label A+++
51
Label E
24
Label A+
19
Label A++
11
Label A++++
11
Label A+++++
0
| Year | Gas (m3) | Electricity (kWh) |
|---|---|---|
| 2020 | 1.530 | 3.150 |
| 2021 | 1.700 | 3.160 |
| 2022 | 1.330 | 3.040 |
| 2023 | 1.100 | 2.860 |
| 2024 | 1.040 | 3.030 |
Hoekwoning
Gas: 870 • Electricity: 2.330
Huurwoning
Gas: 890 • Electricity: 2.030
Koopwoning
Gas: 1.160 • Electricity: 3.110
Appartement
Gas: 880 • Electricity: 2.380
Tussenwoning
Gas: 730 • Electricity: 1.920
Vrijstaande woning
Gas: 1.340 • Electricity: 3.430
Twee-onder-één-kap woning
Gas: 1.010 • Electricity: 2.700
Total number of company establishments: 460
| Period | Crimes |
|---|---|
| jan 2026 | 3 |
| jul 2025 | 8 |
| jun 2025 | 3 |
| mei 2025 | 6 |
| mrt 2025 | 0 |
| mrt 2026 | 4 |
| nov 2024 | 4 |
| nov 2025 | 4 |
| okt 2024 | 7 |
| okt 2025 | 4 |
| sep 2024 | 4 |
| sep 2025 | 5 |
These figures give an indicative picture of safety trends in the living environment of Nijeveen.
Short answers based on current local statistics, handy for a quick comparison of the living environment.
Nijeveen telt in 2026 ongeveer 4.039 inwoners.
De gemiddelde WOZ-waarde in Nijeveen is in 2025 circa € 375.000.
Het gemiddelde inkomen per inwoner in Nijeveen ligt rond € 33.300 per jaar.
Voor het huidige jaar gaat het om ongeveer 45 geregistreerde misdrijven. Gebruik deze cijfers als indicatie en vergelijk trends per periode.
In Nijeveen komt vooral "Vrijstaande woningen" veel voor, met ongeveer 718 woningen.