Residents
31.640
Last year: 2025
3863GC Nijkerk • Gelderland
€ 790.000 k.k.
Cost of copper (estimated): € 17.650
2% transfer tax (€ 15.800) + notary (€ 1.150) + valuation (€ 700)
Total incl. VAT: € 807.650
Purchase price /m²: € 4.817
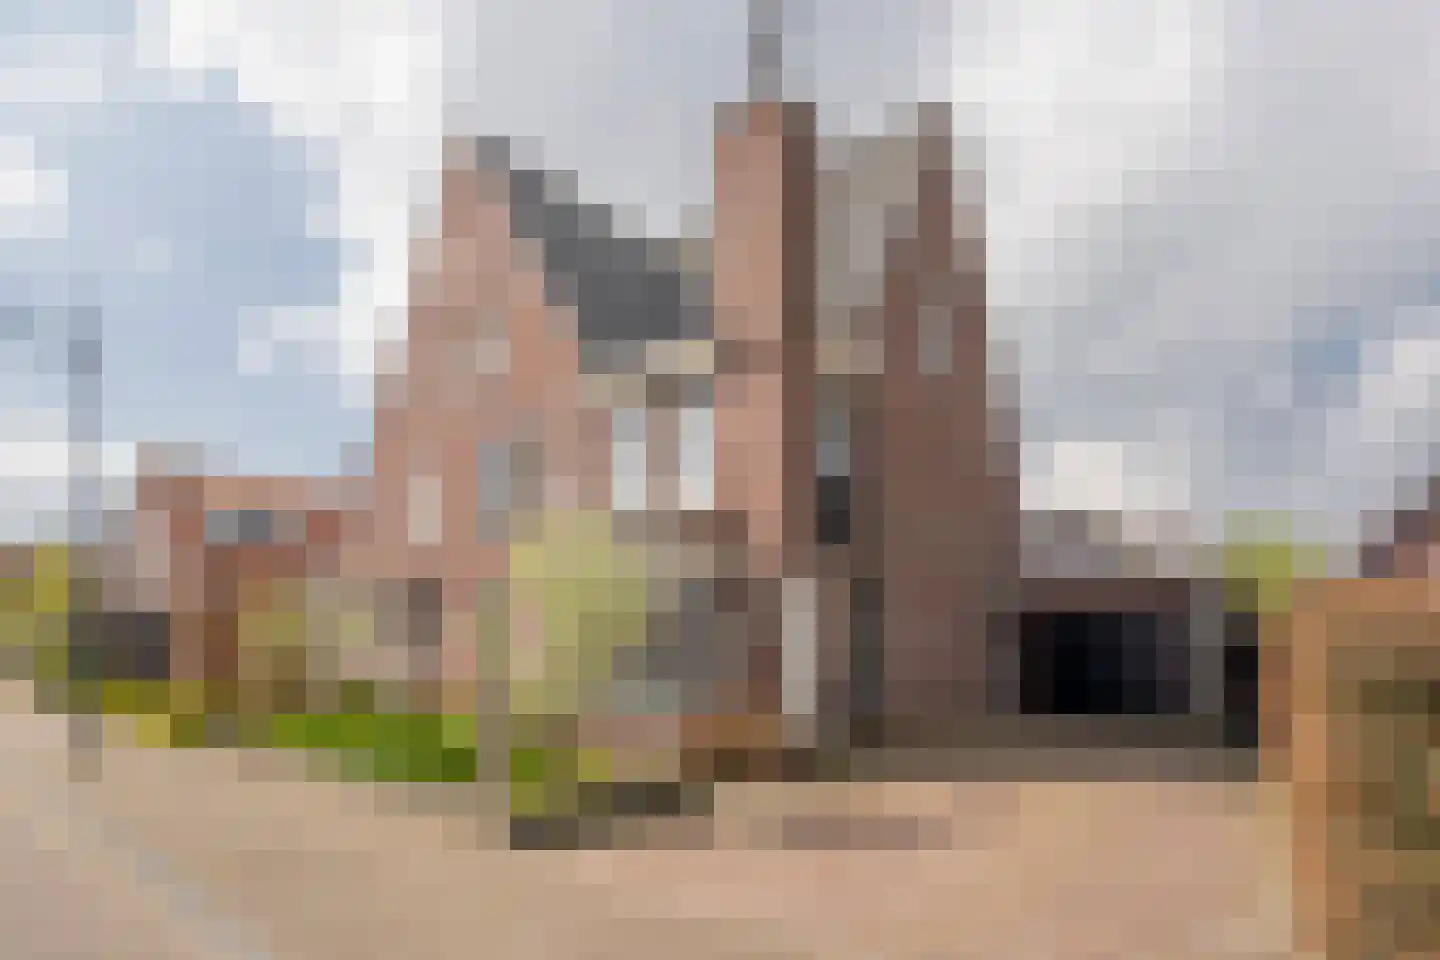
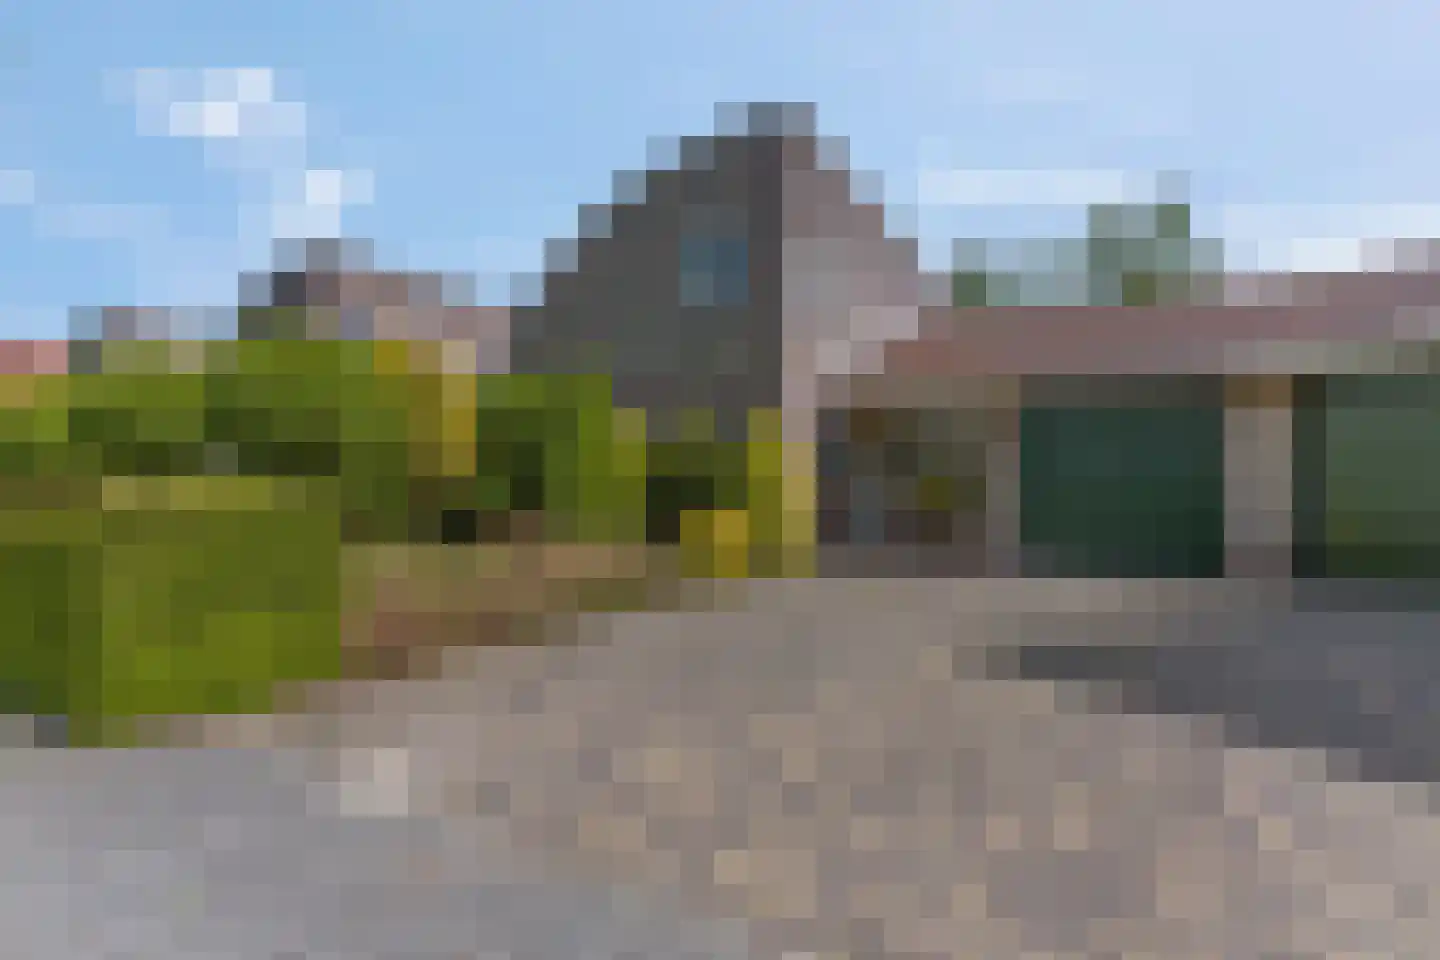
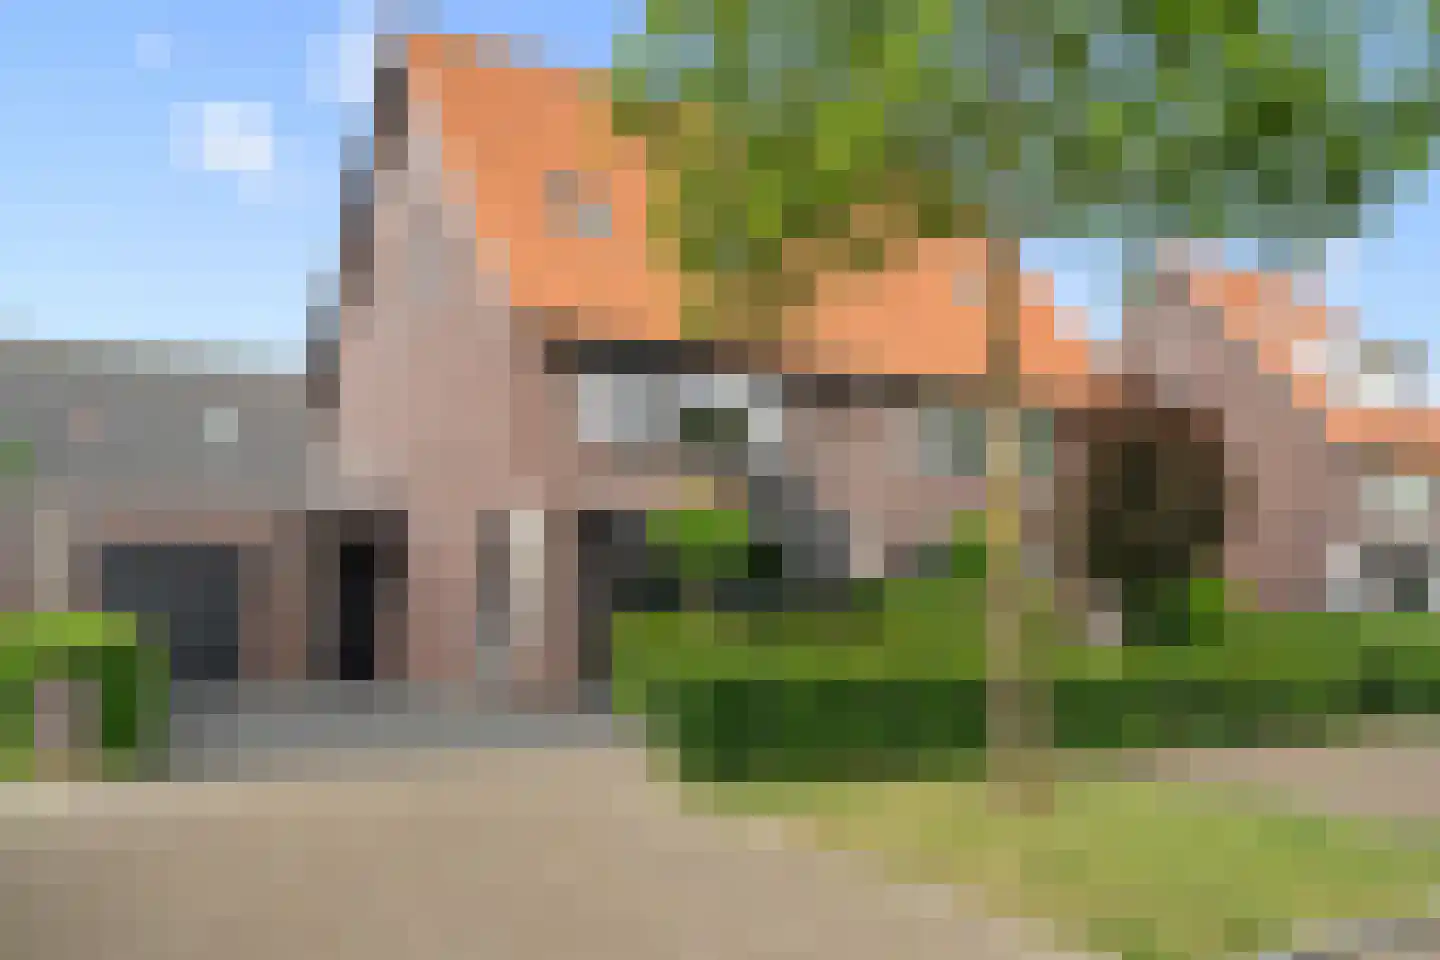
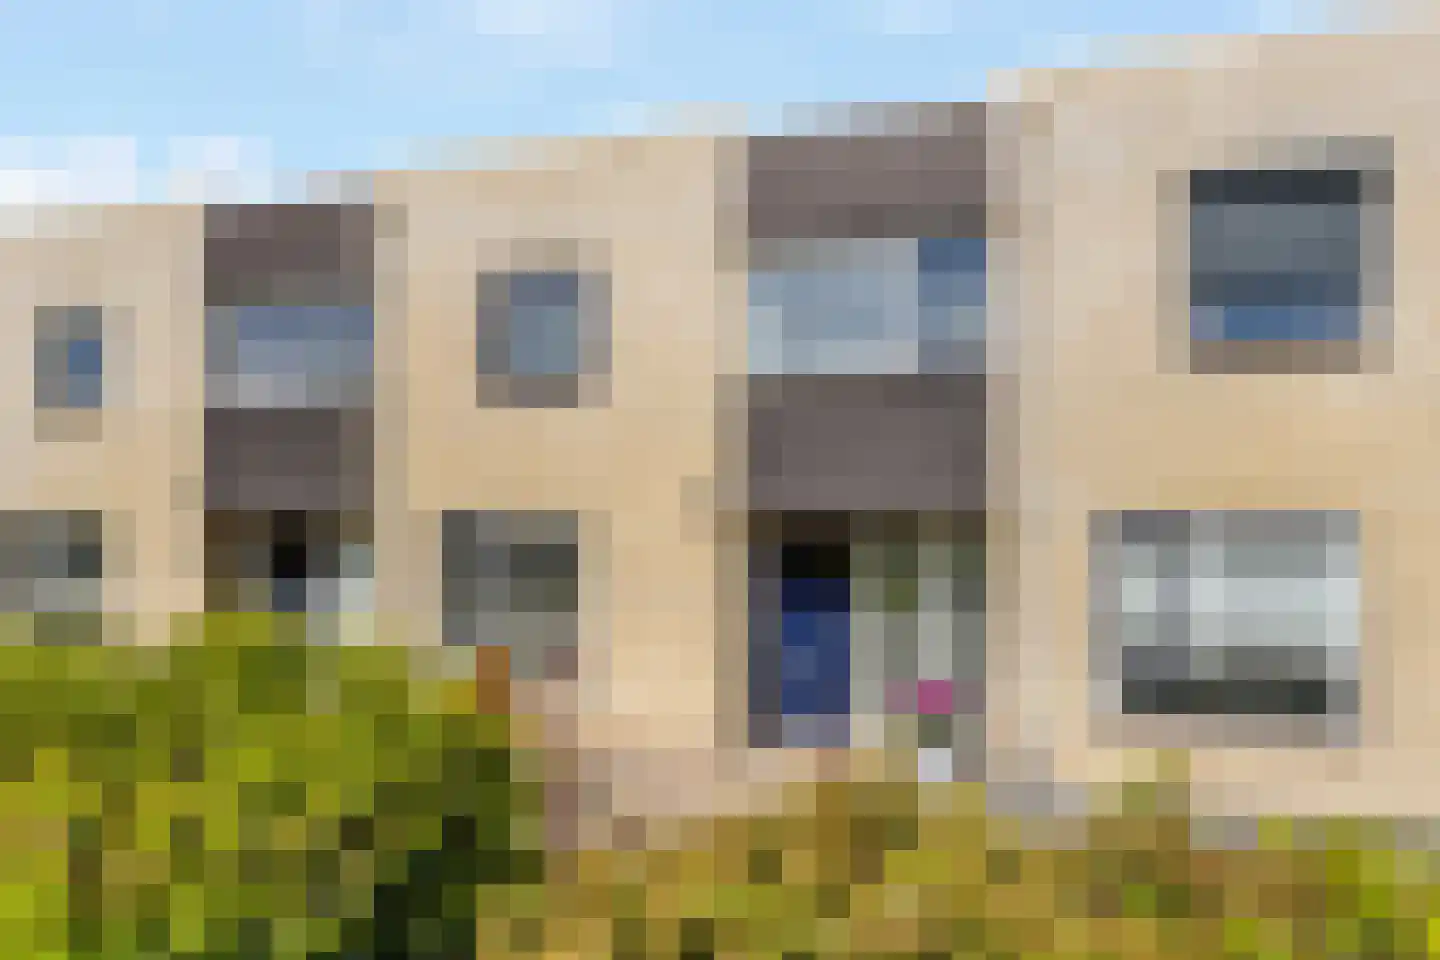
Royale en statig HELFT VAN DUBBEL woonhuis met garage, oprit en een zonnige tuin In een rustige straat in een mooie en kindvriendelijke woonwijk staat dit royale en statige HELFT VAN DUBBEL WOONHUIS op de gewilde Kleine Vos. De woning is de afgelopen jaren gemoderniseerd en uitgebouwd, waardoor er een heerlijk ruim en comfortabel gezinshuis is ontstaan. Op de hoek van de straat is een speeltuin. Met een woonoppervlakte van 164 m² en een perceel van 290 m², een ruime oprit, een aangebouwde garage (binnendoor bereikbaar) én 12 zonnepanelen, biedt deze woning alles wat je zoekt. Daarbij ligt de woning op korte afstand van scholen, supermarkt en uitvalswegen. Ook in details onderscheidt deze woning zich. Denk aan stijlvolle vensterbanken van natuursteen en zorgvuldig geselecteerde materialen. Indeling Begane grond: Via de entree met meterkast en moderne toiletruimte kom je binnen. Vanuit de hal heb je tevens een praktische doorgang naar de aangebouwde garage. De royale leefruimte is opgedeeld in twee sfeervolle delen. Aan de voorzijde bevindt zich de gezellige woonkamer met eikenhouten vloerdelen voorzien van vloerverwarming, een sfeervolle haard, een maatwerk wandkast met wijnklimaatkast en een praktische trapkast. De mooie stalen pui met schuifdeuren vormt een prachtige overgang naar de woonkeuken. De onlangs in 2024 verbouwde luxe woonkeuken is een lichte en uitnodigende ruimte, voorzien van een hoogwaardige keukenopstelling met volledig geïntegreerde Miele-inbouwapparatuur en een kookeiland met eetbar. Dankzij de openslaande deuren naar de tuin ontstaat hier een heerlijk binnen-buitengevoel, waarbij je de tuin als het ware bij de keuken betrekt, perfect voor lange avonden tafelen en genieten. Daarnaast is er ruimte voor een speelhoek of een fijne thuiswerkplek. De woonkeuken is tevens ook voorzien van vloerverwarming. Eerste verdieping: De ruime overloop geeft toegang tot drie royale slaapkamers en de badkamer. Aan de voorzijde bevinden zich twee slaapkamers, waaronder de ouderslaapkamer met een walk-in closet. De tweede slaapkamer is extra licht dankzij een zijraam. Aan de achterzijde ligt de ruime badkamer, voorzien van een douchecabine, ligbad, dubbele wastafelmeubel en een wandcloset. De derde slaapkamer beschikt over een dakkapel. De gehele verdieping is afgewerkt met een strakke pvc vloer. Tweede verdieping: Via een vaste trap bereik je de tweede verdieping. Hier vind je een zeer royale overloop met een raam, bergruimte en een aparte was-/c.v.-ruimte met de c.v.-combiketel en wasmachine-aansluiting. Daarnaast zijn er nog twee slaapkamers, beide voorzien van een raam en een pvc vloer. Via een vlizotrap bereik je de royale bergzolder, ideaal voor extra opslag. De tuin De achtertuin is heerlijk zonnig gelegen op het westen, waardoor je hier de hele dag tot in de avond van de zon kunt genieten. Een fijne plek om te ontspannen of gezellig buiten te zitten. Via de oprit is er naast de garage een ruime achterom aanwezig, wat het geheel extra praktisch maakt. Bijzonderheden: - Royaal en statig helft van dubbel woonhuis - Uitgebouwd en gemoderniseerd - Woonoppervlakte 164 m² en een perceel van 290 m² - Luxe woonkeuken (2024) met een kookeiland - Sfeervolle woonkamer met haard en maatwerkkast - 12 zonnepanelen en vloerverwarming op de begane grond - 5 slaapkamers en een badkamer met ligbad, douche en dubbele wastafels - Aangebouwde garage (binnendoor bereikbaar) en een ruime oprit en achterom - Zonnige tuin op het westen - Gelegen in een rustige, kindvriendelijke woonwijk - Dichtbij scholen, supermarkt en uitvalswegen Kortom: een ruim, modern en sfeervol gezinshuis met luxe afwerking en een heerlijke ligging.
€ 790.000
Cost of copper (estimated): € 17.650
2% transfer tax (€ 15.800) + notary (€ 1.150) + valuation (€ 700)
Total purchase (incl. p.p.): € 807.650
3,21%
Yearly
€ 39.500
Direct available
Estimated mortgage
Indicative gross monthly cost
Based on annuity and 30 year term
Indicative net monthly cost
iDisclaimer: this mortgage calculation is a simplified indication based on general assumptions. No rights can be derived from the results shown. Calculated with 10-annual interest (zonder NHG), automatically determined based on the price limit € 470.000. Source: 10-jaars rente uit mortgage_rates (08-06-2026 03:45). For non-NHG, an 80% mortgage of the market value has been used in this indication.
Douche, dubbele wastafel, ligbad, toilet, en wastafelmeubel
Spatial overview of the work area in Nijkerk
View current location data on residents, WOZ development, housing stock, energy consumption, business activity and safety in Nijkerk. In 2025 were there 31.640 residents. The average WOZ value in 2025 is EUR 468.307.
Residents
31.640
Last year: 2025
Average WOZ
EUR 468.307
Last year: 2025
Average income per person.
EUR 29.548
Source: AllNumbers
Crimes (current year)
850
Total registered
| Year | Residents |
|---|---|
| 2021 | 29.910 |
| 2022 | 30.360 |
| 2023 | 30.935 |
| 2024 | 31.340 |
| 2025 | 31.640 |
| Year | Average WOZ |
|---|---|
| 2021 | EUR 339.420 |
| 2022 | EUR 367.729 |
| 2023 | EUR 421.236 |
| 2024 | EUR 448.170 |
| 2025 | EUR 468.307 |
Hoger
6.740
Praktisch
6.470
Middelbaar
9.820
Europa
1.710
Nederland
26.340
Buiten Europa
3.600
Label A
4.322
Label C
3.254
Label B
2.133
Label D
899
Label G
653
Label A+++
648
Label F
537
Label E
390
Label A+
324
Label A++
255
Label A++++
187
Label A+++++
14
| Year | Gas (m3) | Electricity (kWh) |
|---|---|---|
| 2020 | 1.201 | 2.974 |
| 2021 | 1.361 | 3.021 |
| 2022 | 1.068 | 2.860 |
| 2023 | 888 | 2.700 |
| 2024 | 852 | 2.774 |
Hoekwoning
Gas: 929 • Electricity: 2.760
Huurwoning
Gas: 739 • Electricity: 2.054
Koopwoning
Gas: 963 • Electricity: 3.016
Appartement
Gas: 625 • Electricity: 1.825
Tussenwoning
Gas: 798 • Electricity: 2.455
Vrijstaande woning
Gas: 1.371 • Electricity: 4.001
Twee-onder-één-kap woning
Gas: 1.034 • Electricity: 3.327
Total number of company establishments: 4.645
| Period | Crimes |
|---|---|
| jan 2026 | 72 |
| jul 2025 | 72 |
| jun 2025 | 61 |
| mei 2025 | 76 |
| mrt 2025 | 64 |
| mrt 2026 | 69 |
| nov 2024 | 65 |
| nov 2025 | 78 |
| okt 2024 | 78 |
| okt 2025 | 66 |
| sep 2024 | 92 |
| sep 2025 | 73 |
These figures give an indicative picture of safety trends in the living environment of Nijkerk.
Short answers based on current local statistics, handy for a quick comparison of the living environment.
Nijkerk telt in 2025 ongeveer 31.640 inwoners.
De gemiddelde WOZ-waarde in Nijkerk is in 2025 circa € 468.307.
Het gemiddelde inkomen per inwoner in Nijkerk ligt rond € 29.548 per jaar.
Voor het huidige jaar gaat het om ongeveer 850 geregistreerde misdrijven. Gebruik deze cijfers als indicatie en vergelijk trends per periode.
In Nijkerk komt vooral "Tussenwoningen" veel voor, met ongeveer 4.809 woningen.
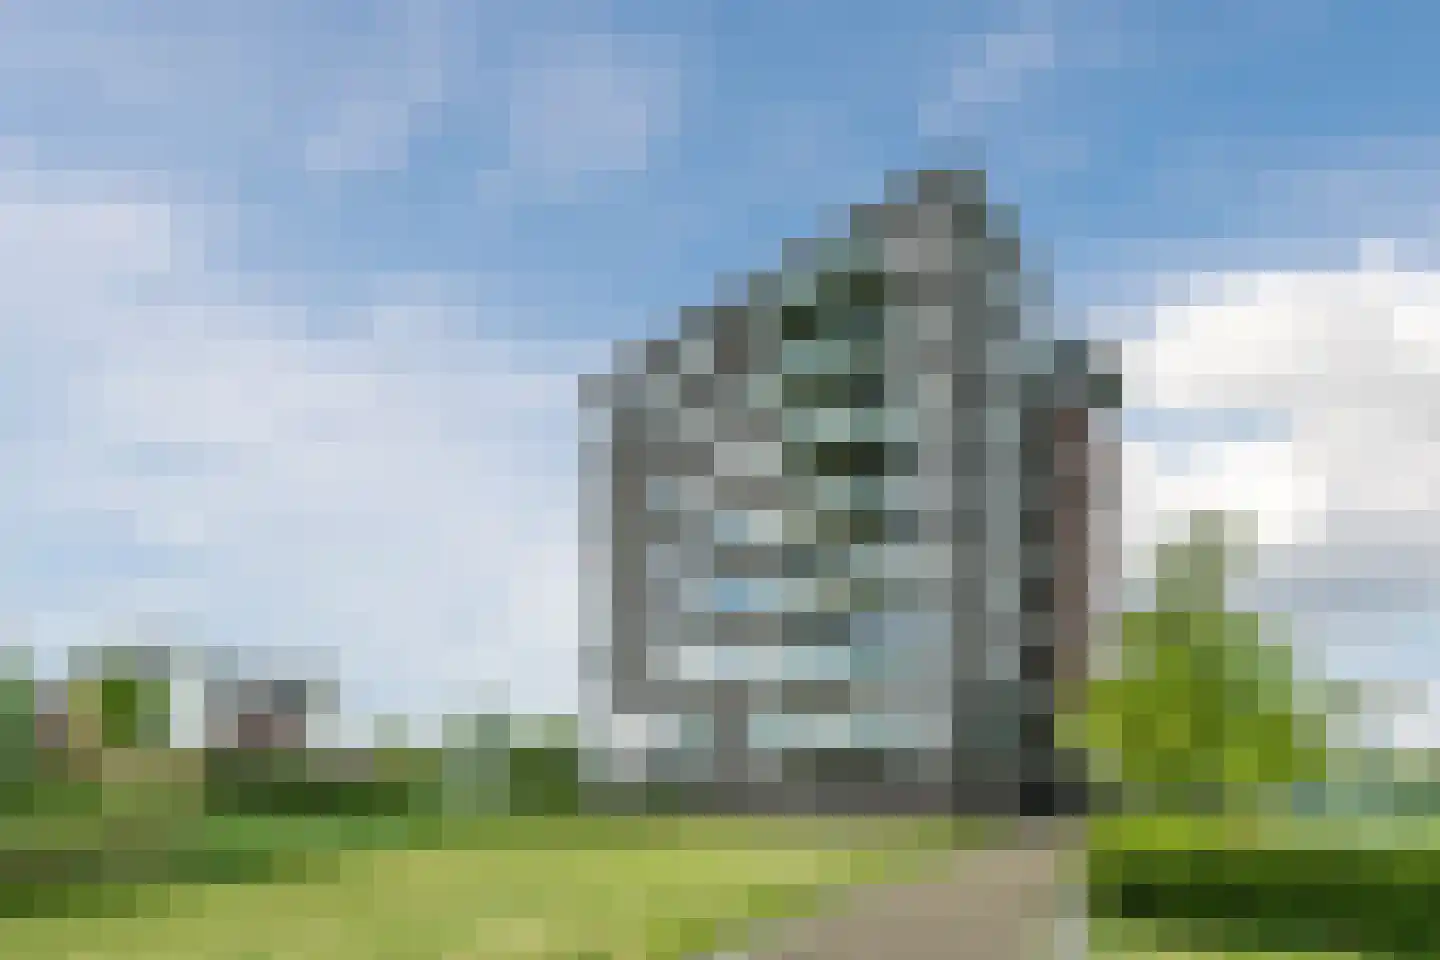
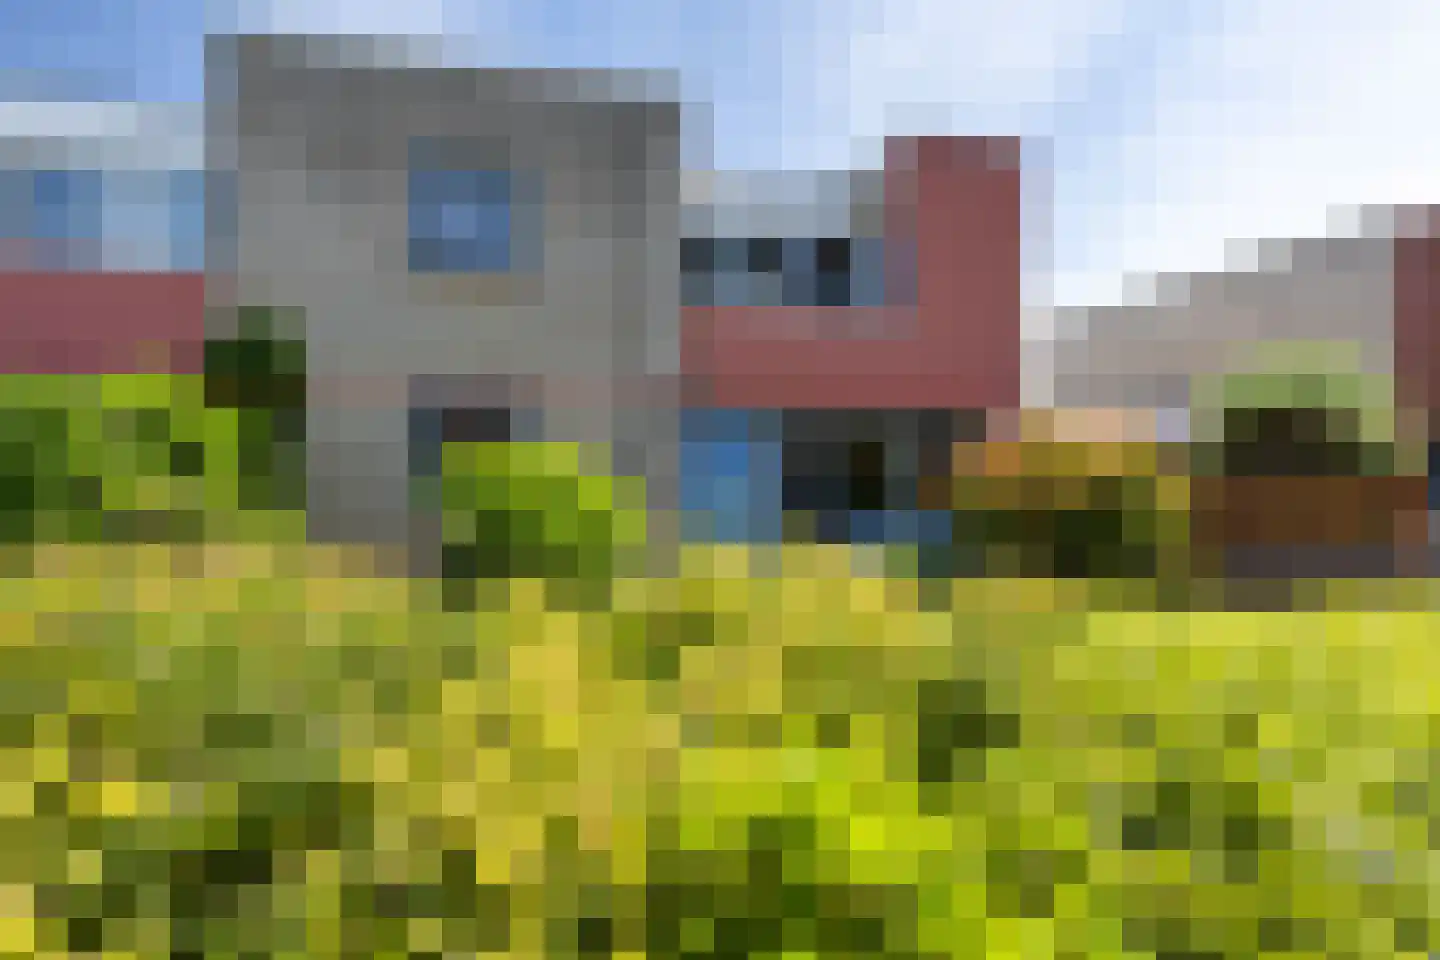
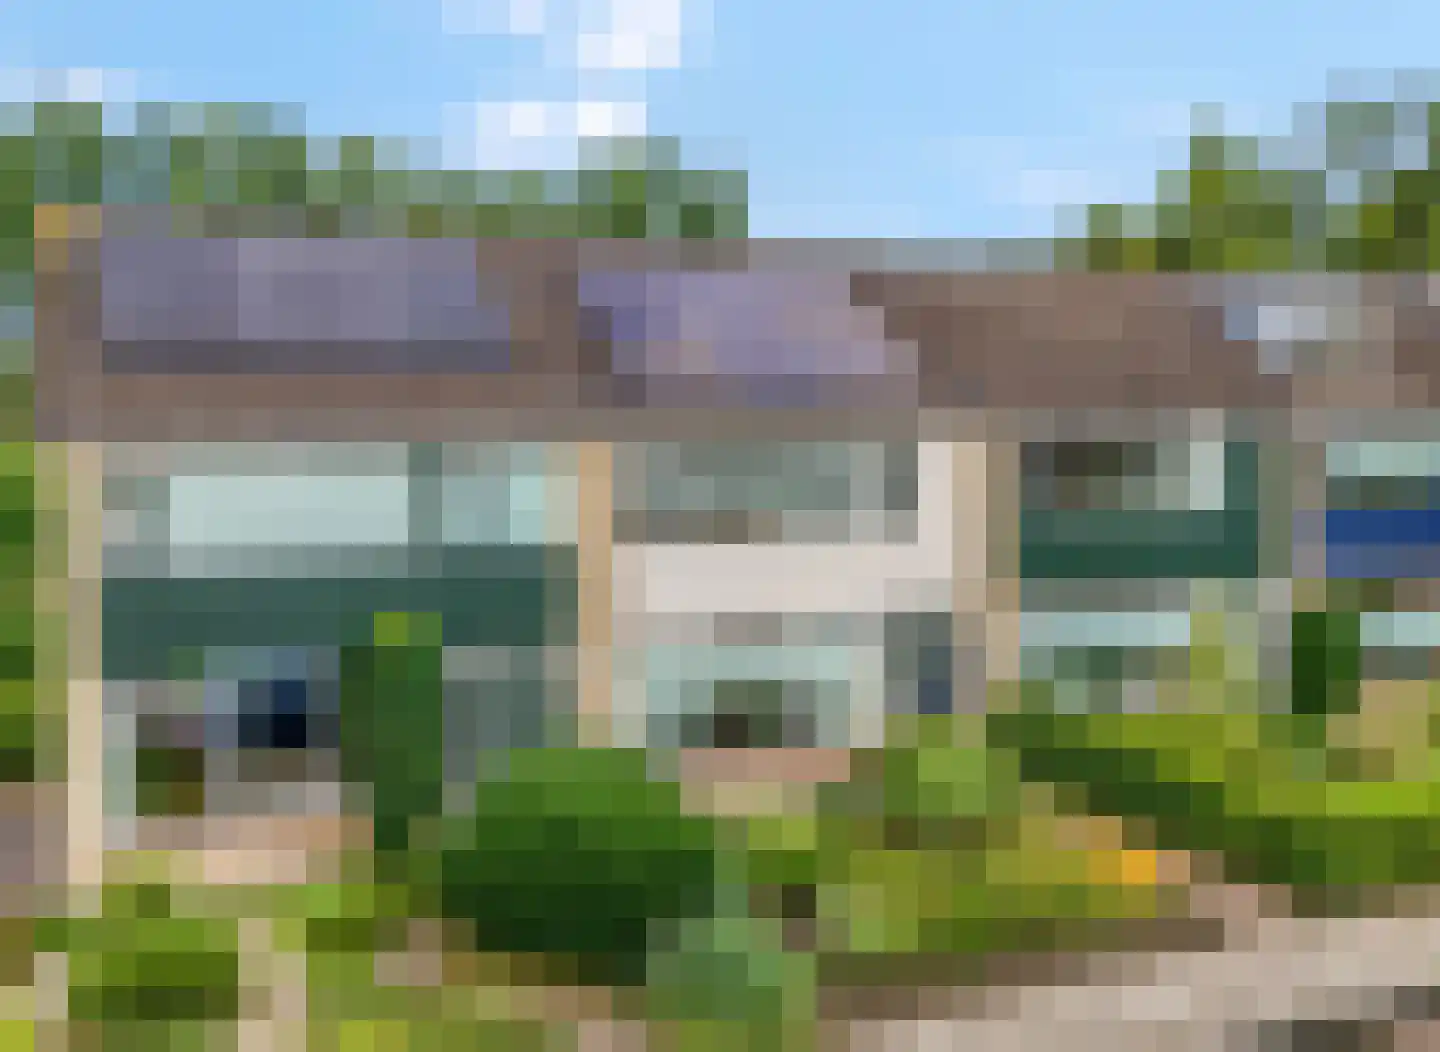
View more homes in this location.

3862CZ Nijkerk
€ 429.000 k.k.
€ 5.645/m²
3863AK Nijkerk
€ 700.000 k.k.
€ 5.385/m²
3863GH Nijkerk
€ 739.500 k.k.
€ 5.398/m²
3863VC Nijkerk
€ 625.000 k.k.
€ 4.921/m²
3863EH Nijkerk
€ 465.000 k.k.
€ 4.079/m²
3863EW Nijkerk
€ 369.000 k.k.
€ 5.271/m²
3862EE Nijkerk
€ 475.000 k.k.
€ 3.831/m²

3861VS Nijkerk
€ 425.000 k.k.
€ 3.512/m²
