Residents
1.800
Last year: 2025
4709AB Nispen • Noord-Brabant
€ 429.000 k.k.
Cost of copper (estimated): € 10.430
2% transfer tax (€ 8.580) + notary (€ 1.150) + valuation (€ 700)
Total incl. VAT: € 439.430
Purchase price /m²: € 2.715
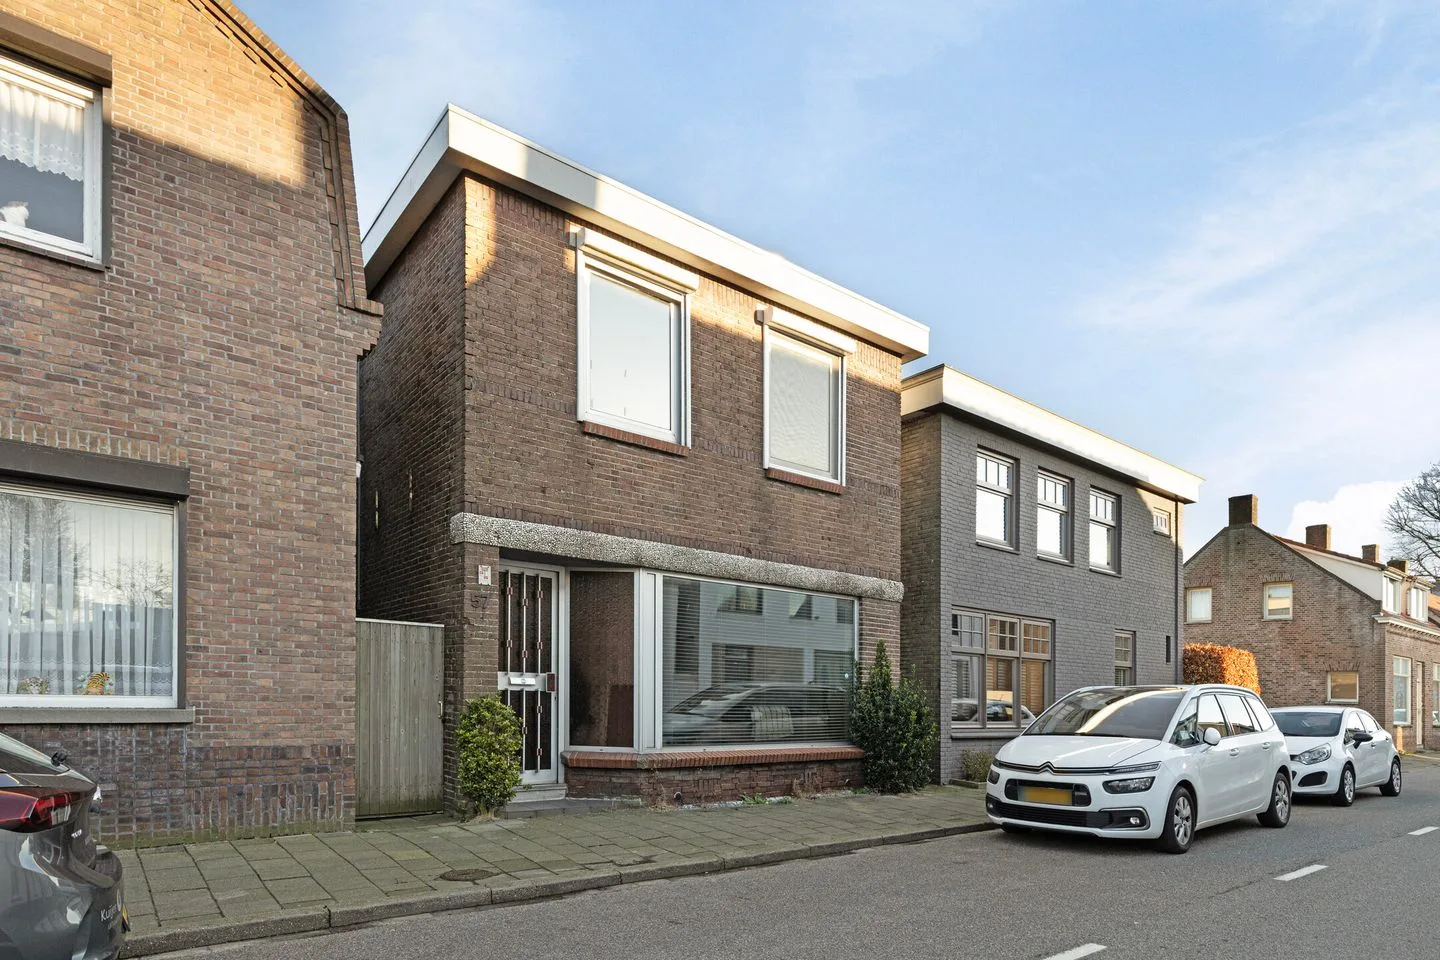
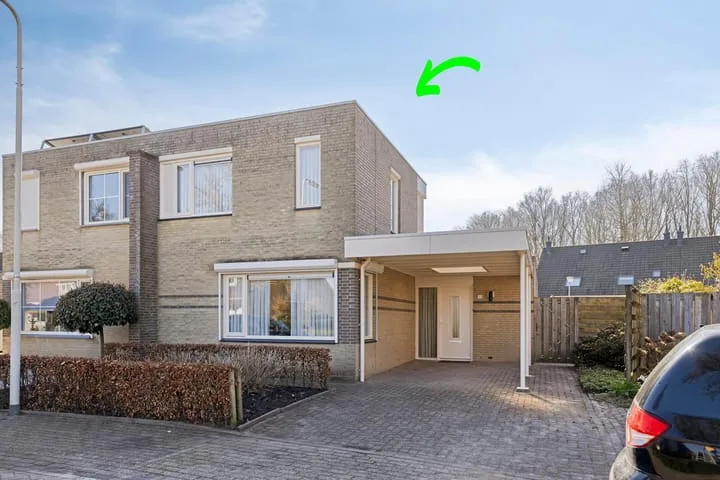
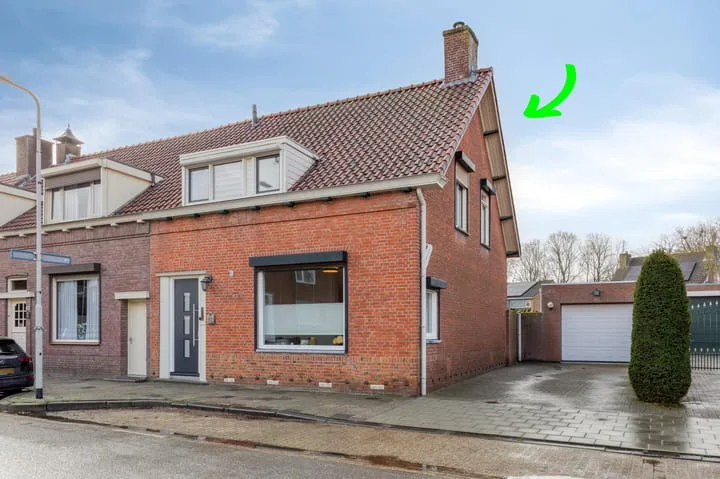
Dorpsstraat 57 in Nispen is een ruime woning met veel potentie voor verbetering en aangepaste indeling. Met een lichte woonkamer, gesloten keuken en drie slaapkamers op de eerste verdieping biedt deze woning vele opties om het gezin of buitenactiviteiten te ondersteunen. De grote tuin met drie garages en houten berging verrijkt de ruimte tot een ideale plek voor rust en privacy. Daarnaast zijn er 12 zonnepanelen aanwezig, wat het huis duurzaam maakt. Tevens biedt de woning extra mogelijkheden zoals een walk-in closet en verschillende tuinfunctionaliteiten die perfect zijn om je eigen smaak op te drukken. Met veel leefruimte binnen en buiten is Dorpsstraat 57 een prachtige optie voor wie naar ruimte, comfort en vrijheid zoekt in Nispen.
€ 429.000
Cost of copper (estimated): € 10.430
2% transfer tax (€ 8.580) + notary (€ 1.150) + valuation (€ 700)
Total purchase (incl. p.p.): € 439.430
2,78%
Yearly
€ 21.450
Direct available
Estimated mortgage
Indicative gross monthly cost
Based on annuity and 30 year term
Indicative net monthly cost
iDisclaimer: this mortgage calculation is a simplified indication based on general assumptions. No rights can be derived from the results shown. Calculated with 10-annual interest (met NHG), automatically determined based on the price limit € 470.000. Source: 10-jaars rente uit mortgage_rates (06-05-2026 03:45).
Ligbad, toilet, en wastafel
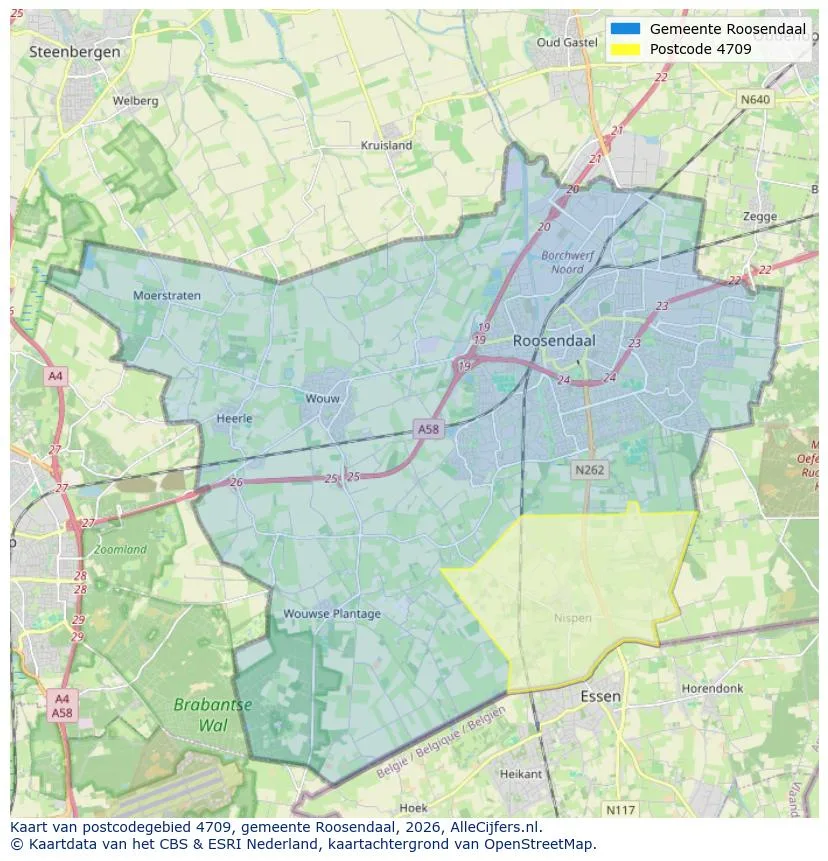
Geographic orientation and real estate agent density in Nispen
View current location data on residents, WOZ development, housing stock, energy consumption, business activity and safety in Nispen. In 2025 were there 1.800 residents. The average WOZ value in 2025 is EUR 453.000.
Residents
1.800
Last year: 2025
Average WOZ
EUR 453.000
Last year: 2025
Average income per person.
EUR 31.200
Source: AllNumbers
Crimes (current year)
54
Total registered
| Year | Residents |
|---|---|
| 2021 | 1.740 |
| 2022 | 1.725 |
| 2023 | 1.745 |
| 2024 | 1.810 |
| 2025 | 1.800 |
| Year | Average WOZ |
|---|---|
| 2021 | EUR 349.000 |
| 2022 | EUR 366.000 |
| 2023 | EUR 407.000 |
| 2024 | EUR 425.000 |
| 2025 | EUR 453.000 |
Hoger
330
Praktisch
330
Middelbaar
700
Europa
430
Nederland
1.305
Buiten Europa
65
Label C
161
Label A
117
Label G
102
Label B
87
Label D
86
Label F
76
Label E
44
Label A+
7
Label A+++
4
Label A++
2
Label A++++
1
Label A+++++
0
| Year | Gas (m3) | Electricity (kWh) |
|---|---|---|
| 2020 | 1.570 | 3.510 |
| 2021 | 1.790 | 3.600 |
| 2022 | 1.350 | 3.360 |
| 2023 | 1.110 | 3.260 |
| 2024 | 1.080 | 3.300 |
Hoekwoning
Gas: 910 • Electricity: 2.320
Huurwoning
Gas: 930 • Electricity: 2.200
Koopwoning
Gas: 1.150 • Electricity: 3.520
Appartement
Gas: 720 • Electricity: 1.910
Tussenwoning
Gas: 790 • Electricity: 2.350
Vrijstaande woning
Gas: 1.240 • Electricity: 3.850
Twee-onder-één-kap woning
Gas: 1.140 • Electricity: 3.010
Total number of company establishments: 260
| Period | Crimes |
|---|---|
| jan 2026 | 3 |
| jul 2025 | 5 |
| jun 2025 | 8 |
| mei 2025 | 6 |
| mrt 2025 | 2 |
| mrt 2026 | 6 |
| nov 2024 | 3 |
| nov 2025 | 3 |
| okt 2024 | 1 |
| okt 2025 | 2 |
| sep 2024 | 5 |
| sep 2025 | 5 |
These figures give an indicative picture of safety trends in the living environment of Nispen.
Short answers based on current local statistics, handy for a quick comparison of the living environment.
Nispen telt in 2025 ongeveer 1.800 inwoners.
De gemiddelde WOZ-waarde in Nispen is in 2025 circa € 453.000.
Het gemiddelde inkomen per inwoner in Nispen ligt rond € 31.200 per jaar.
Voor het huidige jaar gaat het om ongeveer 54 geregistreerde misdrijven. Gebruik deze cijfers als indicatie en vergelijk trends per periode.
In Nispen komt vooral "Vrijstaande woningen" veel voor, met ongeveer 370 woningen.
View more homes in this location.
4709AN Nispen
€ 499.000 k.k.
€ 4.193/m²
4709AB Nispen
€ 345.000 k.k.
€ 3.450/m²
4709BV Nispen
€ 379.000 k.k.
€ 4.356/m²
4709AC Nispen
€ 450.000 k.k.
€ 3.719/m²

4709AC Nispen
€ 365.000 k.k.
€ 1.871/m²

4709RN Nispen
€ 735.000 k.k.
€ 5.975/m²

4709AC Nispen
€ 439.000 k.k.
€ 3.456/m²
4709AN Nispen
€ 609.000 k.k.
€ 3.904/m²
