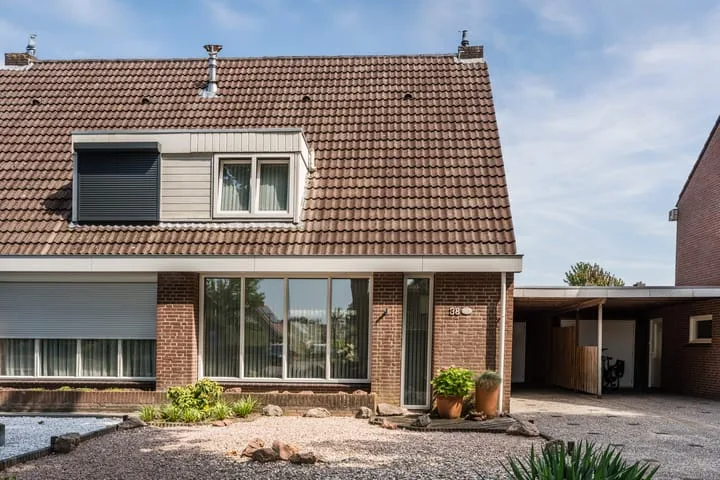
Housing offer in Nistelrode

Searching in 65 houses in Nistelrode

Connected to: Vastgoed Nederland NVM Makelaars

View the current housing stock in Nistelrode and quickly filter by price, living area, rooms and more. There are currently 65 houses in this place within our selection. View also 46 sold houses in Nistelrode for extra insight into the local housing market.

Selection

Search and filter homes

Set your preferences and discover homes that suit you.

Total supply 243.449
Filters

Set price, area and other characteristics. Adjust a filter or click on Show homes. Location changes directly above.

Reset filters

You search for

  • Place Nistelrode

Selling a home in Nistelrode? Compare realtor offers

Get free quotes from real estate agents with local market knowledge. Compare more than 54 real estate agents in Nistelrode.

Free request a quote

  • Quotes in Nistelrode
  • Non-binding
  • Personal
  • Compare free rates

Selling a home in Nistelrode? Compare all real estate agents in Nistelrode or view the top 10 real estate agents in Nistelrode for extra context for your choice.

Compare multiple quotes

Real estate agents make sharper offers when they know you're comparing — ask for quotes for sale or purchase.

Frequently asked questions about homes in Nistelrode

Practical answers about housing supply, sales and comparing real estate agents in Nistelrode.

Residential and neighborhood statistics in Nistelrode

View current location data on residents, WOZ development, housing stock, energy consumption, business activity and safety in Nistelrode. In 2025 were there 6.596 residents. The average WOZ value in 2025 is EUR 472.489.

These figures help to better assess and compare the housing stock in Nistelrode with recent sold homes. Orient yourself then on suitable top real estate agents in Nistelrode for sales advice in this region.

Residents

6.596

Last year: 2025

Average WOZ

EUR 472.489

Last year: 2025

Average income per person.

EUR 31.682

Source: AllNumbers

Crimes (current year)

192

Total registered

Demographics and WOZ development

Inhabitants per year

Inhabitants per year in Nistelrode
Year Residents
2021 6.261
2022 6.332
2023 6.512
2024 6.548
2025 6.596

Annual WOZ value

WOZ value per year in Nistelrode
Year Average WOZ
2021 EUR 334.047
2022 EUR 373.789
2023 EUR 425.834
2024 EUR 451.673
2025 EUR 472.489

Composition of residents

Age build-up

65+: 1.566 0-15: 967 15-25: 729 25-45: 1.529 45-65: 1.823

Education level

Hoger

820

Praktisch

1.281

Middelbaar

2.004

Origin of residents (2025)

Europa

430

Nederland

5.794

Buiten Europa

388

Housing stock and construction periods

Types of homes

Hoekwoningen 445
Appartementen 311
Tussenwoningen 672
Vrijstaande woningen 1.036
Twee-onder-één-kap woningen 498

Construction period of buildings

Voor 1700 1
1700 tot 1900 35
1900 tot 1925 90
1925 tot 1950 150
1950 tot 1970 611
1970 tot 1980 510
1980 tot 1990 396
1990 tot 2000 293
2000 tot 2010 208
2010 tot 2020 174
2020 en later 339

Energy and sustainability

Energy label distribution

Label A

689

Label C

676

Label B

533

Label D

259

Label F

169

Label G

167

Label A+++

118

Label E

69

Label A+

64

Label A++

27

Label A++++

19

Label A+++++

1

Average energy consumption per year

Average energy consumption per year in Nistelrode
Year Gas (m3) Electricity (kWh)
2020 1.475 3.565
2021 1.671 3.605
2022 1.303 3.335
2023 1.059 3.162
2024 983 3.194

Consumption per house type

Hoekwoning

Gas: 744 • Electricity: 2.152

Huurwoning

Gas: 946 • Electricity: 2.581

Koopwoning

Gas: 1.131 • Electricity: 3.453

Appartement

Gas: 580 • Electricity: 1.722

Tussenwoning

Gas: 660 • Electricity: 2.099

Vrijstaande woning

Gas: 1.373 • Electricity: 3.764

Twee-onder-één-kap woning

Gas: 1.112 • Electricity: 3.243

Business activity in Nistelrode (2025)

Handel en HORECA 159
Nijverheid en energie 201
Zakelijke dienstverlening 188
Overheid, onderwijs en zorg 122
Landbouw, bosbouw en visserij 89
Vervoer, informatie en communicatie 45
Financiele diensten en onroerendgoed 52
Cultuur, recreatie en overige diensten 92

Total number of company establishments: 963

Recent crime statistics

Recent crime statistics in Nistelrode
Period Crimes
jan 2025 18
jan 2026 14
jul 2025 11
jun 2025 13
mei 2025 14
mrt 2025 13
nov 2024 13
nov 2025 19
okt 2024 26
okt 2025 21
sep 2024 13
sep 2025 25

These figures give an indicative picture of safety trends in the living environment of Nistelrode.

Frequently asked questions about living in Nistelrode

Short answers based on current local statistics, handy for a quick comparison of the living environment.

Hoeveel inwoners heeft Nistelrode?

Nistelrode telt in 2025 ongeveer 6.596 inwoners.

Wat is de gemiddelde WOZ-waarde in Nistelrode?

De gemiddelde WOZ-waarde in Nistelrode is in 2025 circa € 472.489.

Wat is het gemiddelde inkomen per inwoner in Nistelrode?

Het gemiddelde inkomen per inwoner in Nistelrode ligt rond € 31.682 per jaar.

Hoe veilig is wonen in Nistelrode?

Voor het huidige jaar gaat het om ongeveer 192 geregistreerde misdrijven. Gebruik deze cijfers als indicatie en vergelijk trends per periode.

Welke woningtypen komen het meest voor in Nistelrode?

In Nistelrode komt vooral "Vrijstaande woningen" veel voor, met ongeveer 1.036 woningen.

Receive free, non-binding quotes

Compare multiple real estate agents and choose the best match.