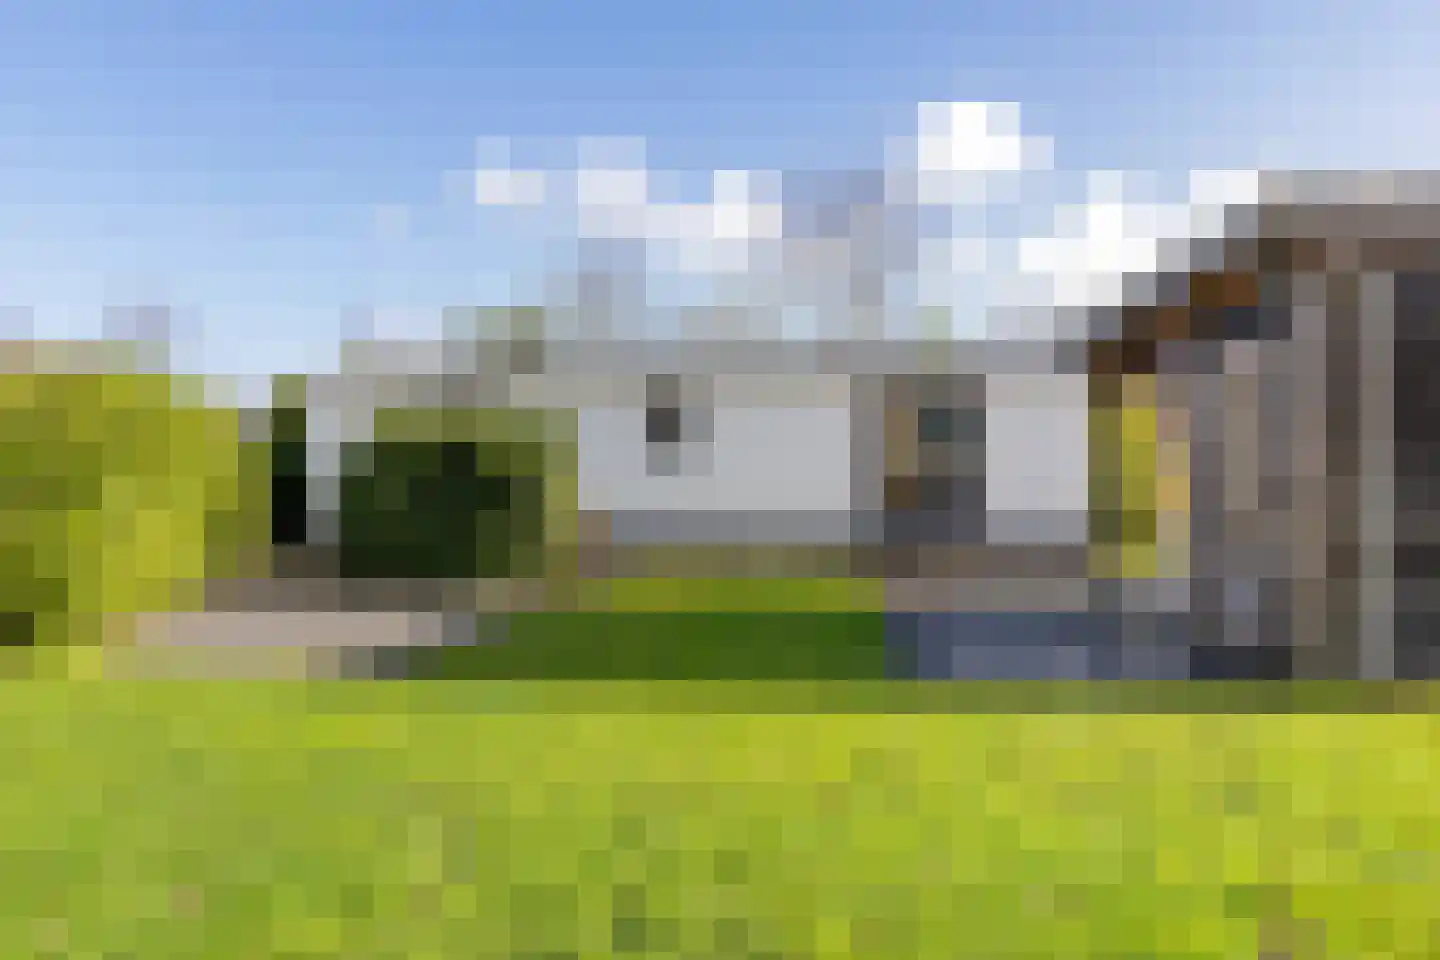
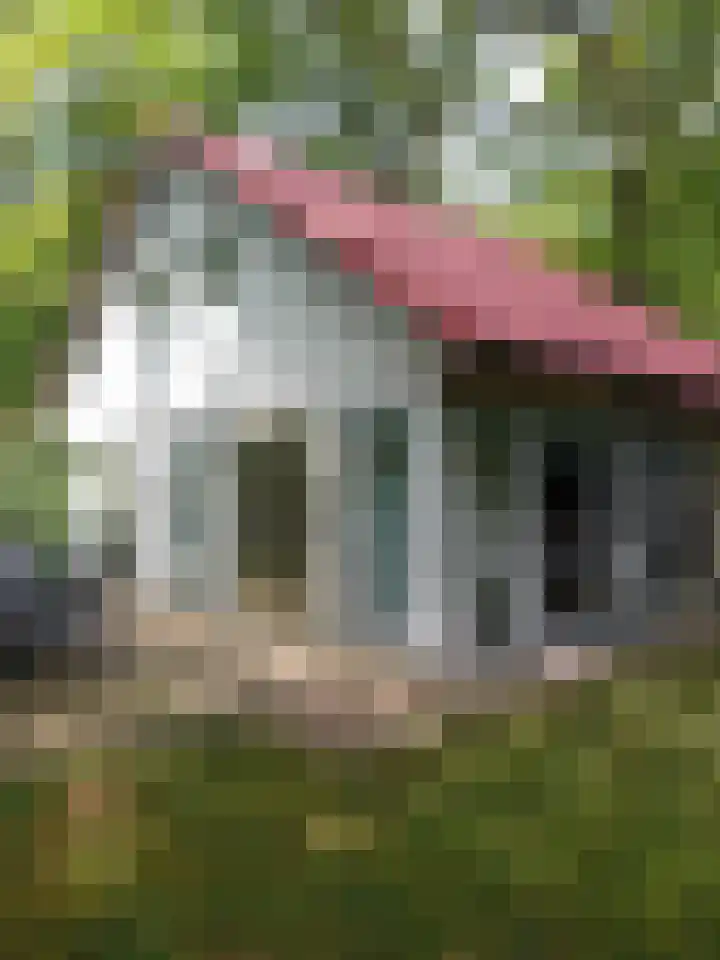
- Sold
Beukenlaan 5 0022
8567HD Oudemirdum
€ 245.000 k.k.
- Living area
- 51 m²
- Land area
- 337 m²
- Bedrooms
- 2
View 16 sold houses in Oudemirdum
Type to search. Use arrow down and arrow up to navigate through results and press Enter to open.
Hidden search suggestions.
Compare sold homes in Oudemirdum or view the current offering in this location directly.
On this page you will find recently sold homes in Oudemirdum. Use this overview to better estimate selling prices, popular neighborhoods, and the local housing supply before you choose a real estate agent. Also view the current housing supply with 24 houses in Oudemirdum.
8567HD Oudemirdum
€ 245.000 k.k.
8567HJ Oudemirdum
€ 99.000
€ 2.152/m²
8567JL Oudemirdum
€ 335.000 k.k.
€ 2.887/m²
8567HD Oudemirdum
€ 264.500 k.k.
€ 5.273/m²
8567JT Oudemirdum
€ 330.000 k.k.
€ 3.666/m²
8567JT Oudemirdum
€ 330.000 k.k.
€ 3.666/m²
8567LJ Oudemirdum
€ 450.000 k.k.
€ 3.719/m²
8567KB Oudemirdum
€ 685.000 k.k.
€ 3.407/m²
8567LJ Oudemirdum
€ 295.000 k.k.
€ 3.314/m²
8567KC Oudemirdum
€ 595.000 k.k.
€ 3.324/m²
8567HG Oudemirdum
€ 369.000 k.k.
€ 5.590/m²
8567LP Oudemirdum
€ 649.000 k.k.
€ 4.056/m²
8567JJ Oudemirdum
€ 290.000 k.k.
€ 0/m²
8567JT Oudemirdum
€ 339.000 k.k.
€ 3.896/m²
8567JV Oudemirdum
€ 275.000 k.k.
€ 2.806/m²
8567HJ Oudemirdum
€ 87.000
€ 2.350/m²
View recent sales and receive free quotes from local real estate agents. Compare more than 15 real estate agents in Oudemirdum.
Selling your own home in Oudemirdum? Compare real estate agents in Oudemirdum or view the best real estate agents in Oudemirdum as a reference for your choice.
Real estate agents make sharper offers when they know you're comparing — ask for quotes for sale or purchase.
Short answers about housing prices, sold homes and comparing real estate agents in Oudemirdum.
The costs of a real estate agent in Oudemirdum vary per office, property type and sales approach. In Oudemirdum you can compare 15 real estate agents; therefore also look at the real estate agents in Oudemirdum to better compare fees, presentation and local experience.
On this page we currently show 16 sold houses in Oudemirdum from our selection. This helps you to better assess recent transactions and the local housing market.
Houses sold in Oudemirdum give insight into asking prices, house types and neighborhoods where recent transactions have taken place. Compare this also with the current housing stock in Oudemirdum to better understand the market.
You can use sold homes as a first market indication, but a local real estate agent can better take into account finishing, location, maintenance and current demand in Oudemirdum.
Compare the 15 real estate agents in Oudemirdum on local sales experience, reviews, expected yield, commission and marketing approach. View real estate agents in Oudemirdum or the top 10 agents in Oudemirdum to quickly discover strong offices.
View current location data on residents, WOZ development, housing stock, energy consumption, business activity and safety in Oudemirdum. In 2026 were there 1.406 residents. The average WOZ value in 2025 is EUR 400.000.
These figures help to better assess and compare the housing stock in Oudemirdum with recent sold homes. Orient yourself then on suitable top real estate agents in Oudemirdum for sales advice in this region.
Residents
1.406
Last year: 2026
Average WOZ
EUR 400.000
Last year: 2025
Average income per person.
EUR 28.100
Source: AllNumbers
Crimes (current year)
18
Total registered
| Year | Residents |
|---|---|
| 2021 | 1.380 |
| 2022 | 1.360 |
| 2023 | 1.395 |
| 2024 | 1.380 |
| 2025 | 1.380 |
| 2026 | 1.406 |
| Year | Average WOZ |
|---|---|
| 2021 | EUR 280.000 |
| 2022 | EUR 306.000 |
| 2023 | EUR 350.000 |
| 2024 | EUR 378.000 |
| 2025 | EUR 400.000 |
Hoger
260
Praktisch
230
Middelbaar
470
Europa
40
Nederland
1.295
Buiten Europa
45
Label B
190
Label C
151
Label G
113
Label A
77
Label D
63
Label F
59
Label E
18
Label A+++
9
Label A+
7
Label A++++
6
Label A++
0
Label A+++++
0
| Year | Gas (m3) | Electricity (kWh) |
|---|---|---|
| 2020 | 1.560 | 3.130 |
| 2021 | 1.790 | 3.180 |
| 2022 | 1.380 | 3.000 |
| 2023 | 1.170 | 2.870 |
| 2024 | 1.110 | 2.940 |
Hoekwoning
Gas: 1.040 • Electricity: 1.750
Huurwoning
Gas: 960 • Electricity: 1.850
Koopwoning
Gas: 1.230 • Electricity: 3.170
Appartement
Gas: 980 • Electricity: 3.220
Tussenwoning
Gas: 830 • Electricity: 1.890
Vrijstaande woning
Gas: 1.330 • Electricity: 3.430
Twee-onder-één-kap woning
Gas: 970 • Electricity: 2.440
Total number of company establishments: 215
| Period | Crimes |
|---|---|
| jan 2026 | 1 |
| jul 2025 | 1 |
| jun 2025 | 2 |
| mei 2025 | 1 |
| mrt 2025 | 0 |
| mrt 2026 | 1 |
| nov 2024 | 0 |
| nov 2025 | 5 |
| okt 2024 | 1 |
| okt 2025 | 2 |
| sep 2024 | 1 |
| sep 2025 | 0 |
These figures give an indicative picture of safety trends in the living environment of Oudemirdum.
Short answers based on current local statistics, handy for a quick comparison of the living environment.
Oudemirdum telt in 2026 ongeveer 1.406 inwoners.
De gemiddelde WOZ-waarde in Oudemirdum is in 2025 circa € 400.000.
Het gemiddelde inkomen per inwoner in Oudemirdum ligt rond € 28.100 per jaar.
Voor het huidige jaar gaat het om ongeveer 18 geregistreerde misdrijven. Gebruik deze cijfers als indicatie en vergelijk trends per periode.
In Oudemirdum komt vooral "Vrijstaande woningen" veel voor, met ongeveer 340 woningen.