
Residents
8.500
Last year: 2025
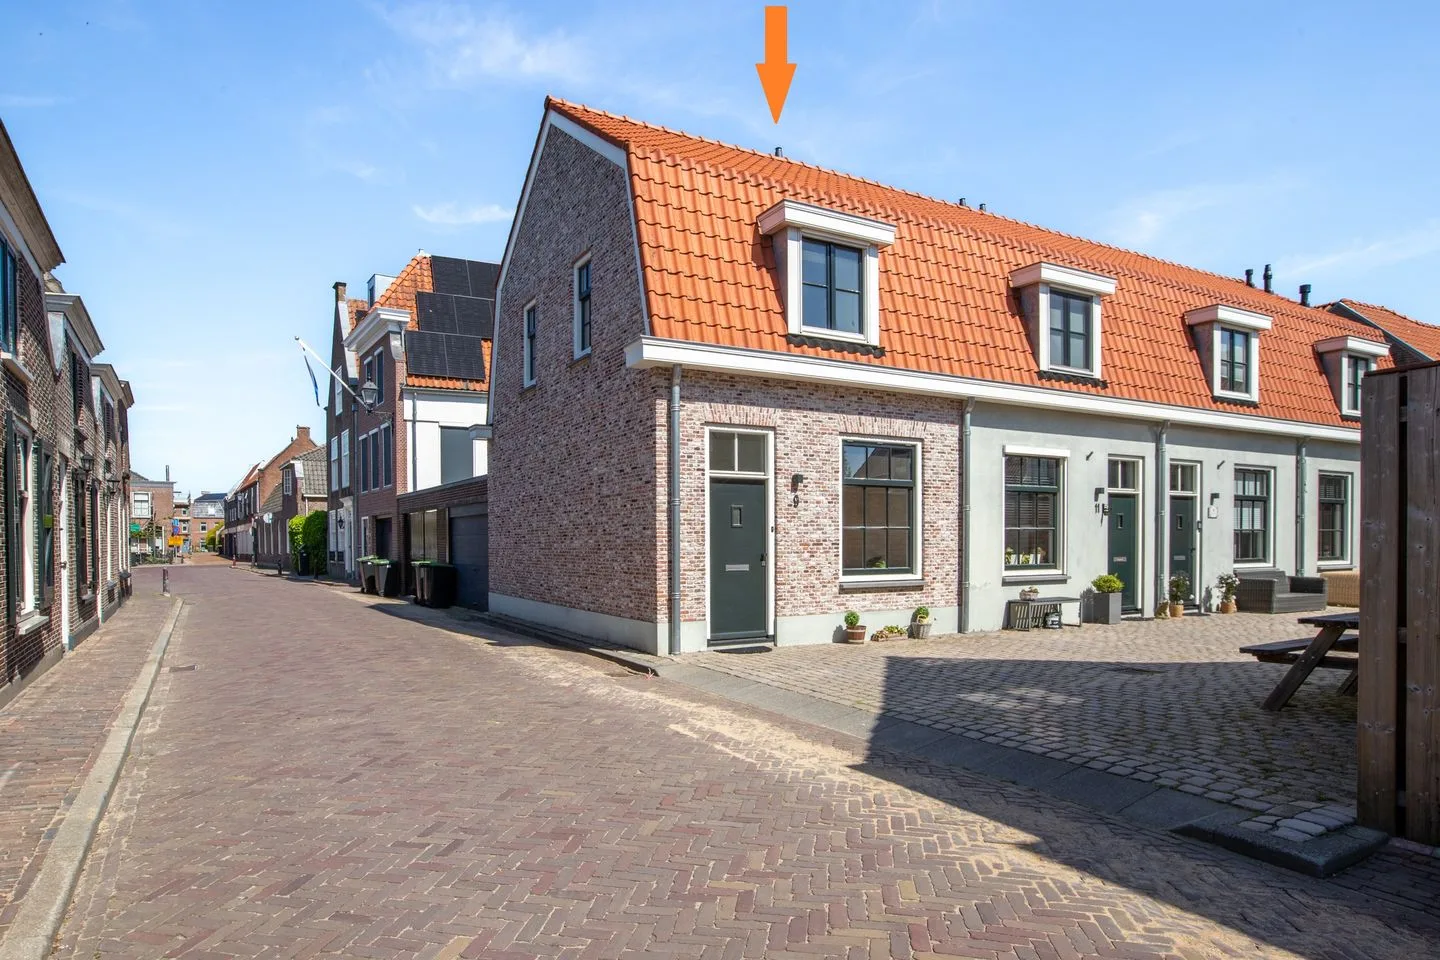
3421CZ Oudewater • Utrecht
For this property, no detailed description is available yet.
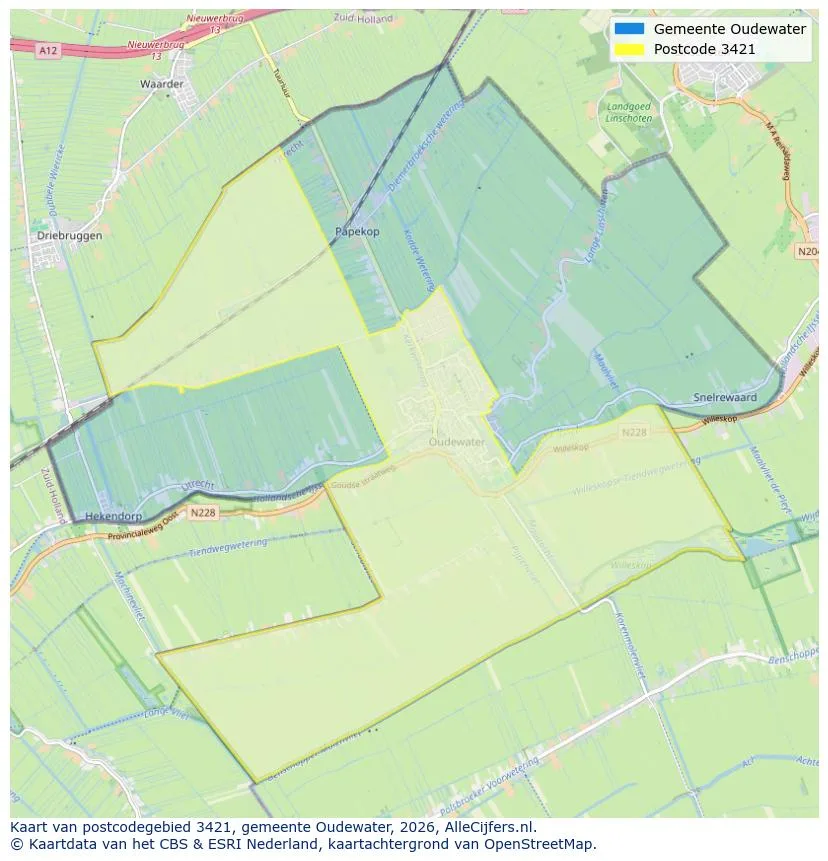
Discover where agents are active in Oudewater
View current location data on residents, WOZ development, housing stock, energy consumption, business activity and safety in Oudewater. In 2025 were there 8.500 residents. The average WOZ value in 2025 is EUR 415.000.
Residents
8.500
Last year: 2025
Average WOZ
EUR 415.000
Last year: 2025
Average income per person.
EUR 35.200
Source: AllNumbers
Crimes (current year)
207
Total registered
| Year | Residents |
|---|---|
| 2021 | 8.245 |
| 2022 | 8.265 |
| 2023 | 8.340 |
| 2024 | 8.370 |
| 2025 | 8.500 |
| Year | Average WOZ |
|---|---|
| 2021 | EUR 322.000 |
| 2022 | EUR 345.000 |
| 2023 | EUR 390.000 |
| 2024 | EUR 394.000 |
| 2025 | EUR 415.000 |
Hoger
1.640
Praktisch
1.560
Middelbaar
2.900
Europa
425
Nederland
7.385
Buiten Europa
690
Label C
1.098
Label A
795
Label B
499
Label D
408
Label G
343
Label F
262
Label E
211
Label A+++
201
Label A+
79
Label A++
36
Label A++++
19
Label A+++++
1
| Year | Gas (m3) | Electricity (kWh) |
|---|---|---|
| 2020 | 1.210 | 2.990 |
| 2021 | 1.370 | 3.050 |
| 2022 | 1.060 | 2.820 |
| 2023 | 900 | 2.610 |
| 2024 | 860 | 2.650 |
Hoekwoning
Gas: 950 • Electricity: 2.640
Huurwoning
Gas: 730 • Electricity: 2.020
Koopwoning
Gas: 980 • Electricity: 2.890
Appartement
Gas: 600 • Electricity: 1.880
Tussenwoning
Gas: 860 • Electricity: 2.510
Vrijstaande woning
Gas: 1.380 • Electricity: 4.090
Twee-onder-één-kap woning
Gas: 1.240 • Electricity: 3.270
Total number of company establishments: 1.360
| Period | Crimes |
|---|---|
| jan 2025 | 9 |
| jan 2026 | 3 |
| jul 2025 | 20 |
| jun 2025 | 16 |
| mei 2025 | 13 |
| mrt 2025 | 41 |
| nov 2024 | 17 |
| nov 2025 | 13 |
| okt 2024 | 12 |
| okt 2025 | 15 |
| sep 2024 | 8 |
| sep 2025 | 15 |
These figures give an indicative picture of safety trends in the living environment of Oudewater.
Short answers based on current local statistics, handy for a quick comparison of the living environment.
Oudewater telt in 2025 ongeveer 8.500 inwoners.
De gemiddelde WOZ-waarde in Oudewater is in 2025 circa € 415.000.
Het gemiddelde inkomen per inwoner in Oudewater ligt rond € 35.200 per jaar.
Voor het huidige jaar gaat het om ongeveer 207 geregistreerde misdrijven. Gebruik deze cijfers als indicatie en vergelijk trends per periode.
In Oudewater komt vooral "Tussenwoningen" veel voor, met ongeveer 1.610 woningen.
View more homes in this location.

3421AZ Oudewater
€ 310.000 k.k.
€ 7.045/m²

3421VB Oudewater
€ 415.000 k.k.
€ 3.268/m²

3421CV Oudewater
€ 915 p/m
€ 23/m²
3421CM Oudewater
€ 339.000 k.k.
€ 5.650/m²

3421SH Oudewater
€ 375.000 k.k.
€ 4.573/m²

3421HH Oudewater
€ 439.000 k.k.
€ 4.526/m²

3421AM Oudewater
€ 395.000 k.k.
€ 4.647/m²

3421AM Oudewater
€ 445.000 k.k.
€ 4.635/m²
