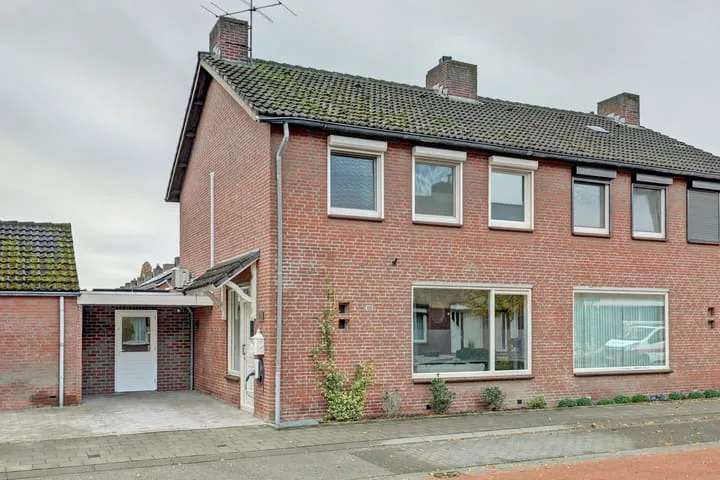
- Sold
Stokserweg 10
5981NE Panningen
€ 385.000 k.k.
€ 3.130/m²
- Living area
- 123 m²
- Land area
- 335 m²
- Bedrooms
- 3
Searching in 62 houses in Panningen
Type to search. Use arrow down and arrow up to navigate through results and press Enter to open.
Hidden search suggestions.
View current properties in Panningen or search targeted on street, postal code and property characteristics.
View the current housing stock in Panningen and quickly filter by price, living area, rooms and more. There are currently 62 houses in this place within our selection. View also 52 sold houses in Panningen for extra insight into the local housing market.
5981NE Panningen
€ 385.000 k.k.
€ 3.130/m²
5981HD Panningen
€ 465.000 k.k.
€ 3.274/m²
5981NH Panningen
€ 330.000 k.k.
€ 4.125/m²
5981CD Panningen
Price upon request
5981BW Panningen
€ 459.000 k.k.
€ 3.209/m²
5981VW Panningen
€ 495.000 k.k.
€ 4.459/m²
5981PD Panningen
€ 435.000 k.k.
€ 3.398/m²
5981VB Panningen
€ 325.000 k.k.
€ 3.009/m²
5981DN Panningen
Price upon request
5981WS Panningen
€ 345.000 k.k.
€ 4.726/m²
5981EE Panningen
Price upon request
5981DM Panningen
€ 197.000 k.k.
€ 4.377/m²
5981DH Panningen
€ 409.000 k.k.
€ 3.352/m²
5981DM Panningen
€ 160.000 k.k.
€ 3.404/m²
5981DJ Panningen
€ 398.000 k.k.
€ 2.992/m²
5981TS Panningen
€ 409.000 k.k.
€ 2.860/m²
5981XC Panningen
€ 385.000 k.k.
€ 2.916/m²
5981BM Panningen
€ 300.000 k.k.
€ 3.000/m²
5981AC Panningen
€ 379.000 k.k.
€ 2.631/m²
5981PG Panningen
€ 550.000 k.k.
€ 0/m²
5981CN Panningen
€ 645.000 k.k.
€ 0/m²
5981WS Panningen
€ 329.000 k.k.
€ 0/m²
5981PB Panningen
€ 595.000 k.k.
€ 5.409/m²
5981AP Panningen
€ 230.000 k.k.
€ 3.833/m²
5981PB Panningen
€ 750.000 k.k.
€ 3.807/m²
5981AE Panningen
€ 539.000 k.k.
€ 3.368/m²
5981CM Panningen
€ 695.000 k.k.
€ 3.994/m²
5981BL Panningen
€ 335.000 k.k.
€ 2.617/m²
Get free quotes from real estate agents with local market knowledge. Compare more than 19 real estate agents in Panningen.
Selling a home in Panningen? View the sales-oriented guide sell a house in Panningen, compare all real estate agents in Panningen or view the top 10 real estate agents in Panningen for extra context to your choice.
Real estate agents make sharper offers when they know you're comparing — ask for quotes for sale or purchase.
Practical answers about housing supply, sales and comparing real estate agents in Panningen.
The costs of a real estate agent in Panningen depend on commission, setup costs, property presentation and the chosen service. Compare the 19 real estate agents in Panningen via the real estate agent page and request multiple quotes to compare rates and approach well.
Within our selection, we are currently showing 62 houses in Panningen. View also the sold houses in Panningen to compare the current offering with recent transactions.
Take into account not only price and living area but also maintenance, energy label, location, outdoor space and sales status. This way you compare houses in Panningen on more than just the asking price.
A local real estate agent knows the neighborhoods, recent transactions and demand in Panningen. By comparing 19 real estate agents in the region you get a better insight into prices, sales strategy and expected yield; the top 10 in Panningen provides a useful starting point.
Yes, when making a sales plan, a valuation in Panningen is wise. You gain insight into a realistic asking price and can then compare offers from real estate agents specifically.
View current location data on residents, WOZ development, housing stock, energy consumption, business activity and safety in Panningen. In 2025 were there 8.010 residents. The average WOZ value in 2025 is EUR 347.000.
These figures help to better assess and compare the housing stock in Panningen with recent sold homes. Orient yourself then on suitable top real estate agents in Panningen for sales advice in this region.
Residents
8.010
Last year: 2025
Average WOZ
EUR 347.000
Last year: 2025
Average income per person.
EUR 31.000
Source: AllNumbers
Crimes (current year)
365
Total registered
| Year | Residents |
|---|---|
| 2021 | 7.559 |
| 2022 | 7.668 |
| 2023 | 7.804 |
| 2024 | 7.825 |
| 2025 | 8.010 |
| Year | Average WOZ |
|---|---|
| 2021 | EUR 277.000 |
| 2022 | EUR 291.000 |
| 2023 | EUR 347.000 |
| 2024 | EUR 324.000 |
| 2025 | EUR 347.000 |
Hoger
1.590
Praktisch
1.730
Middelbaar
2.410
Europa
545
Nederland
6.530
Buiten Europa
930
Label A
1.141
Label C
1.047
Label B
551
Label D
361
Label G
211
Label A+
180
Label F
170
Label E
116
Label A+++
108
Label A++
73
Label A++++
12
Label A+++++
6
| Year | Gas (m3) | Electricity (kWh) |
|---|---|---|
| 2020 | 1.360 | 3.180 |
| 2021 | 1.460 | 3.240 |
| 2022 | 1.130 | 3.030 |
| 2023 | 920 | 2.910 |
| 2024 | 830 | 2.770 |
Hoekwoning
Gas: 860 • Electricity: 2.660
Huurwoning
Gas: 690 • Electricity: 2.040
Koopwoning
Gas: 1.020 • Electricity: 3.280
Appartement
Gas: 590 • Electricity: 1.930
Tussenwoning
Gas: 800 • Electricity: 2.510
Vrijstaande woning
Gas: 1.230 • Electricity: 4.010
Twee-onder-één-kap woning
Gas: 960 • Electricity: 2.890
Total number of company establishments: 1.075
| Period | Crimes |
|---|---|
| jan 2025 | 32 |
| jan 2026 | 33 |
| jul 2025 | 38 |
| jun 2025 | 21 |
| mei 2025 | 18 |
| mrt 2025 | 36 |
| nov 2024 | 33 |
| nov 2025 | 38 |
| okt 2024 | 32 |
| okt 2025 | 31 |
| sep 2024 | 26 |
| sep 2025 | 26 |
These figures give an indicative picture of safety trends in the living environment of Panningen.
Short answers based on current local statistics, handy for a quick comparison of the living environment.
Panningen telt in 2025 ongeveer 8.010 inwoners.
De gemiddelde WOZ-waarde in Panningen is in 2025 circa € 347.000.
Het gemiddelde inkomen per inwoner in Panningen ligt rond € 31.000 per jaar.
Voor het huidige jaar gaat het om ongeveer 365 geregistreerde misdrijven. Gebruik deze cijfers als indicatie en vergelijk trends per periode.
In Panningen komt vooral "Appartementen" veel voor, met ongeveer 1.038 woningen.