- Available
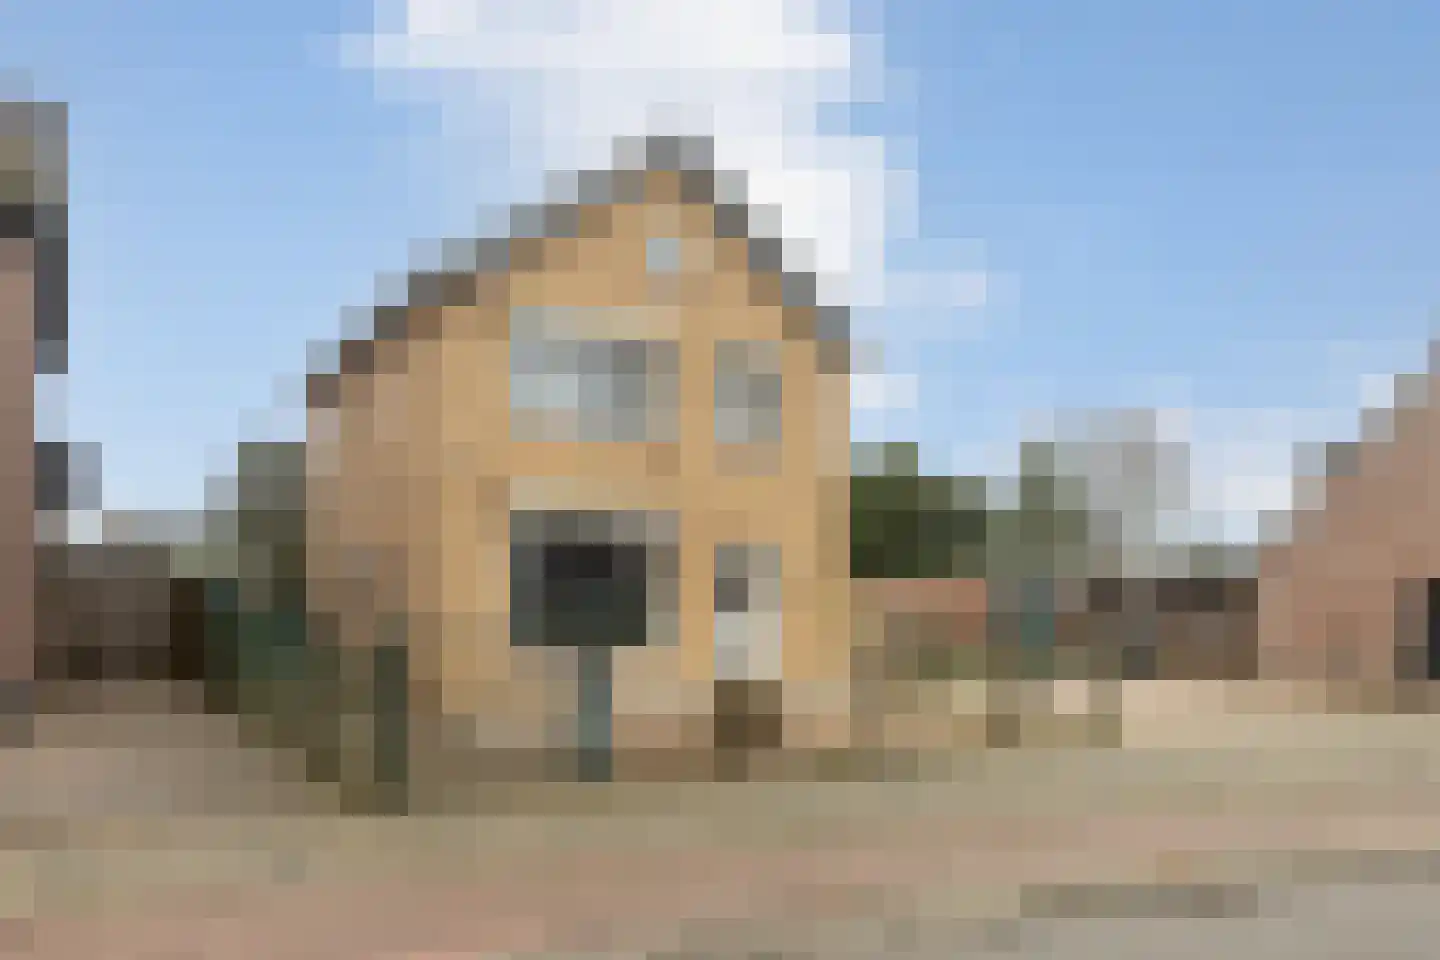
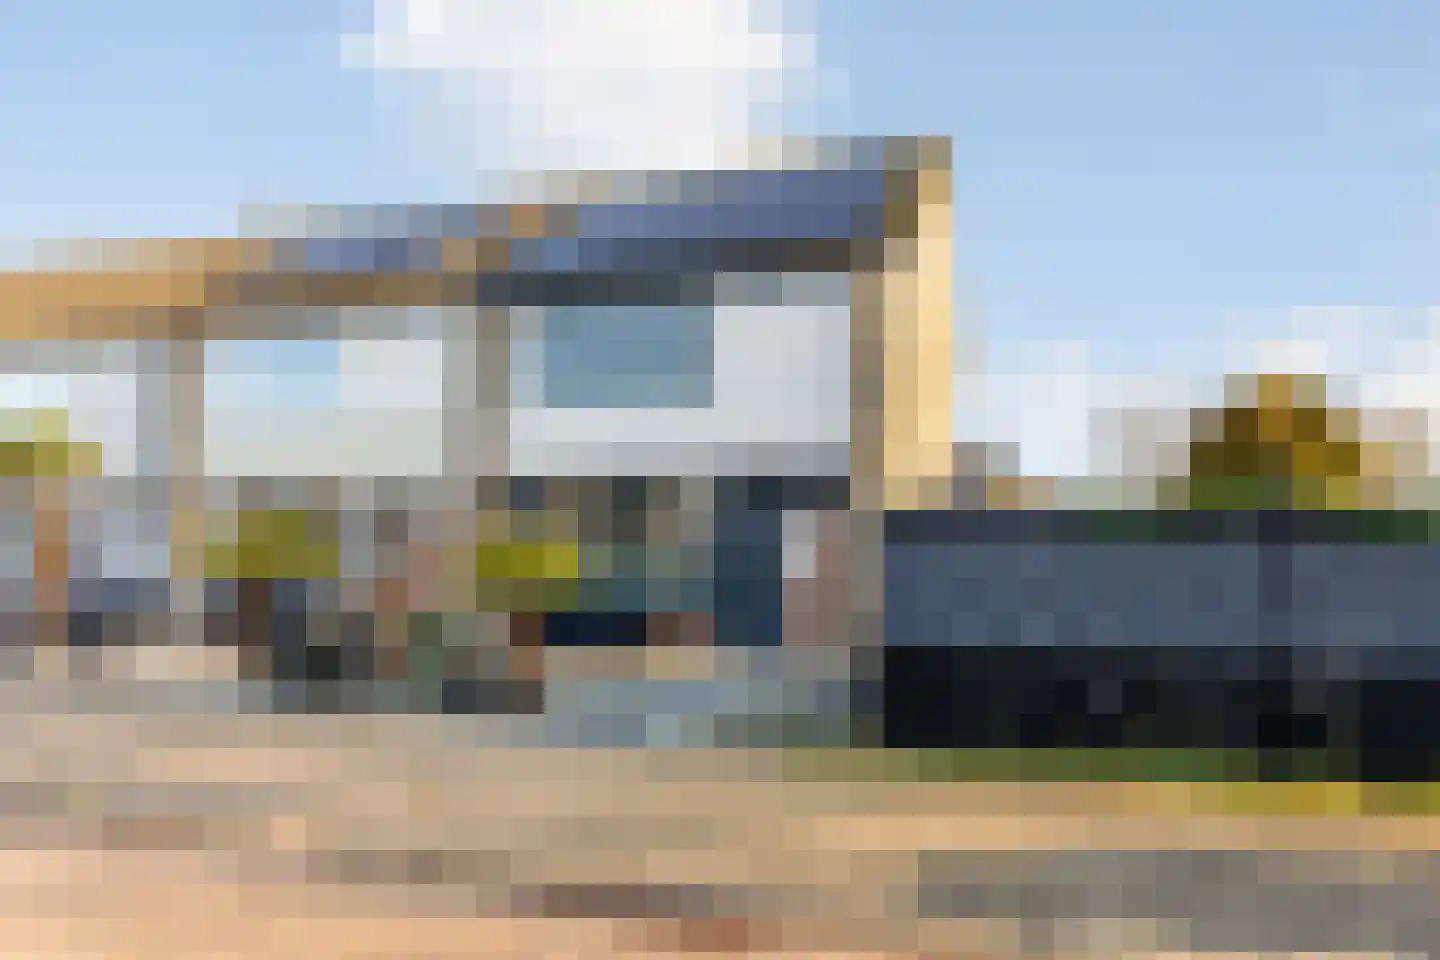
Pastoor Woltersstraat 17
4645EM Putte
€ 415.000 k.k.
€ 3.374/m²
- Living area
- 123 m²
- Land area
- 323 m²
- Bedrooms
- 4
Searching in 81 houses in Putte
Type to search. Use arrow down and arrow up to navigate through results and press Enter to open.
Hidden search suggestions.
View current properties in Putte or search targeted on street, postal code and property characteristics.
View the current housing stock in Putte and quickly filter by price, living area, rooms and more. There are currently 81 houses in this place within our selection. View also 39 sold houses in Putte for extra insight into the local housing market.
4645EM Putte
€ 415.000 k.k.
€ 3.374/m²
4645RT Putte
€ 129.000 k.k.
€ 1.878/m²
4645RW Putte
€ 321.500 k.k.
€ 3.091/m²
4645RW Putte
€ 229.500 k.k.
€ 2.490/m²
4645RW Putte
€ 249.500 k.k.
€ 2.099/m²
4645RW Putte
€ 249.000 k.k.
€ 2.797/m²
4645BN Putte
€ 429.500 k.k.
€ 3.835/m²
4645RW Putte
€ 209.000 k.k.
4645CX Putte
€ 415.000 k.k.
€ 2.255/m²
4645GL Putte
€ 455.000 k.k.
€ 3.447/m²
4645BT Putte
€ 359.000 k.k.
€ 3.205/m²
4645RW Putte
€ 189.000 k.k.
€ 2.054/m²
4645GP Putte
€ 574.500 k.k.
€ 3.419/m²
4645CD Putte
€ 385.000 k.k.
€ 2.916/m²
4645GH Putte
€ 354.000 k.k.
€ 2.565/m²
4645CN Putte
€ 339.000 k.k.
€ 2.948/m²
4645CN Putte
€ 319.000 k.k.
€ 2.848/m²
4645GL Putte
€ 365.000 k.k.
€ 2.607/m²
4645GP Putte
€ 375.000 k.k.
€ 3.048/m²
4645JC Putte
€ 649.000 k.k.
€ 3.840/m²
4645CK Putte
€ 500.000 k.k.
€ 4.545/m²
4645CG Putte
€ 400.000 k.k.
€ 3.200/m²
4645GK Putte
€ 385.000 k.k.
€ 3.105/m²
4645BT Putte
€ 450.000 k.k.
€ 3.488/m²
4645CX Putte
€ 495.000 k.k.
€ 4.459/m²
4645CW Putte
€ 369.000 k.k.
€ 2.838/m²
4645RD Putte
€ 525.000 k.k.
€ 4.605/m²
4645HH Putte
€ 289.000 k.k.
€ 3.481/m²
Get free quotes from real estate agents with local market knowledge. Compare more than 22 real estate agents in Putte.
Selling a home in Putte? Compare all real estate agents in Putte or view the top 10 real estate agents in Putte for extra context for your choice.
Real estate agents make sharper offers when they know you're comparing — ask for quotes for sale or purchase.
Practical answers about housing supply, sales and comparing real estate agents in Putte.
The costs of a real estate agent in Putte depend on commission, setup costs, property presentation and the chosen service. Compare the 22 real estate agents in Putte via the real estate agent page and request multiple quotes to compare rates and approach well.
Within our selection, we are currently showing 81 houses in Putte. View also the sold houses in Putte to compare the current offering with recent transactions.
Take into account not only price and living area but also maintenance, energy label, location, outdoor space and sales status. This way you compare houses in Putte on more than just the asking price.
A local real estate agent knows the neighborhoods, recent transactions and demand in Putte. By comparing 22 real estate agents in the region you get a better insight into prices, sales strategy and expected yield; the top 10 in Putte provides a useful starting point.
Yes, when making a sales plan, a valuation in Putte is wise. You gain insight into a realistic asking price and can then compare offers from real estate agents specifically.
View current location data on residents, WOZ development, housing stock, energy consumption, business activity and safety in Putte. In 2025 were there 3.795 residents. The average WOZ value in 2025 is EUR 326.000.
These figures help to better assess and compare the housing stock in Putte with recent sold homes. Orient yourself then on suitable top real estate agents in Putte for sales advice in this region.
Residents
3.795
Last year: 2025
Average WOZ
EUR 326.000
Last year: 2025
Average income per person.
EUR 31.500
Source: AllNumbers
Crimes (current year)
144
Total registered
| Year | Residents |
|---|---|
| 2021 | 3.785 |
| 2022 | 3.860 |
| 2023 | 3.845 |
| 2024 | 3.870 |
| 2025 | 3.795 |
| Year | Average WOZ |
|---|---|
| 2021 | EUR 250.000 |
| 2022 | EUR 264.000 |
| 2023 | EUR 296.000 |
| 2024 | EUR 305.000 |
| 2025 | EUR 326.000 |
Hoger
360
Praktisch
1.320
Middelbaar
1.160
Europa
1.785
Nederland
1.820
Buiten Europa
195
Label C
690
Label D
322
Label B
290
Label A
230
Label G
157
Label F
145
Label E
92
Label A+
50
Label A++
13
Label A+++
6
Label A++++
1
Label A+++++
0
| Year | Gas (m3) | Electricity (kWh) |
|---|---|---|
| 2020 | 1.420 | 3.150 |
| 2021 | 1.610 | 3.210 |
| 2022 | 1.260 | 3.030 |
| 2023 | 1.050 | 2.920 |
| 2024 | 1.040 | 3.010 |
Hoekwoning
Gas: 1.080 • Electricity: 2.850
Huurwoning
Gas: 830 • Electricity: 2.030
Koopwoning
Gas: 1.120 • Electricity: 3.200
Appartement
Gas: 570 • Electricity: 1.700
Tussenwoning
Gas: 890 • Electricity: 2.610
Vrijstaande woning
Gas: 1.320 • Electricity: 3.650
Twee-onder-één-kap woning
Gas: 1.110 • Electricity: 2.950
Total number of company establishments: 345
| Period | Crimes |
|---|---|
| jan 2026 | 14 |
| jul 2025 | 15 |
| jun 2025 | 12 |
| mei 2025 | 7 |
| mrt 2025 | 15 |
| mrt 2026 | 10 |
| nov 2024 | 13 |
| nov 2025 | 11 |
| okt 2024 | 10 |
| okt 2025 | 11 |
| sep 2024 | 11 |
| sep 2025 | 11 |
These figures give an indicative picture of safety trends in the living environment of Putte.
Short answers based on current local statistics, handy for a quick comparison of the living environment.
Putte telt in 2025 ongeveer 3.795 inwoners.
De gemiddelde WOZ-waarde in Putte is in 2025 circa € 326.000.
Het gemiddelde inkomen per inwoner in Putte ligt rond € 31.500 per jaar.
Voor het huidige jaar gaat het om ongeveer 144 geregistreerde misdrijven. Gebruik deze cijfers als indicatie en vergelijk trends per periode.
In Putte komt vooral "Vrijstaande woningen" veel voor, met ongeveer 620 woningen.