Residents
1.431
Last year: 2026
6668LG Randwijk • Gelderland
€ 975.000 k.k.
Cost of copper (estimated): € 21.350
2% transfer tax (€ 19.500) + notary (€ 1.150) + valuation (€ 700)
Total incl. VAT: € 996.350
Purchase price /m²: € 7.222
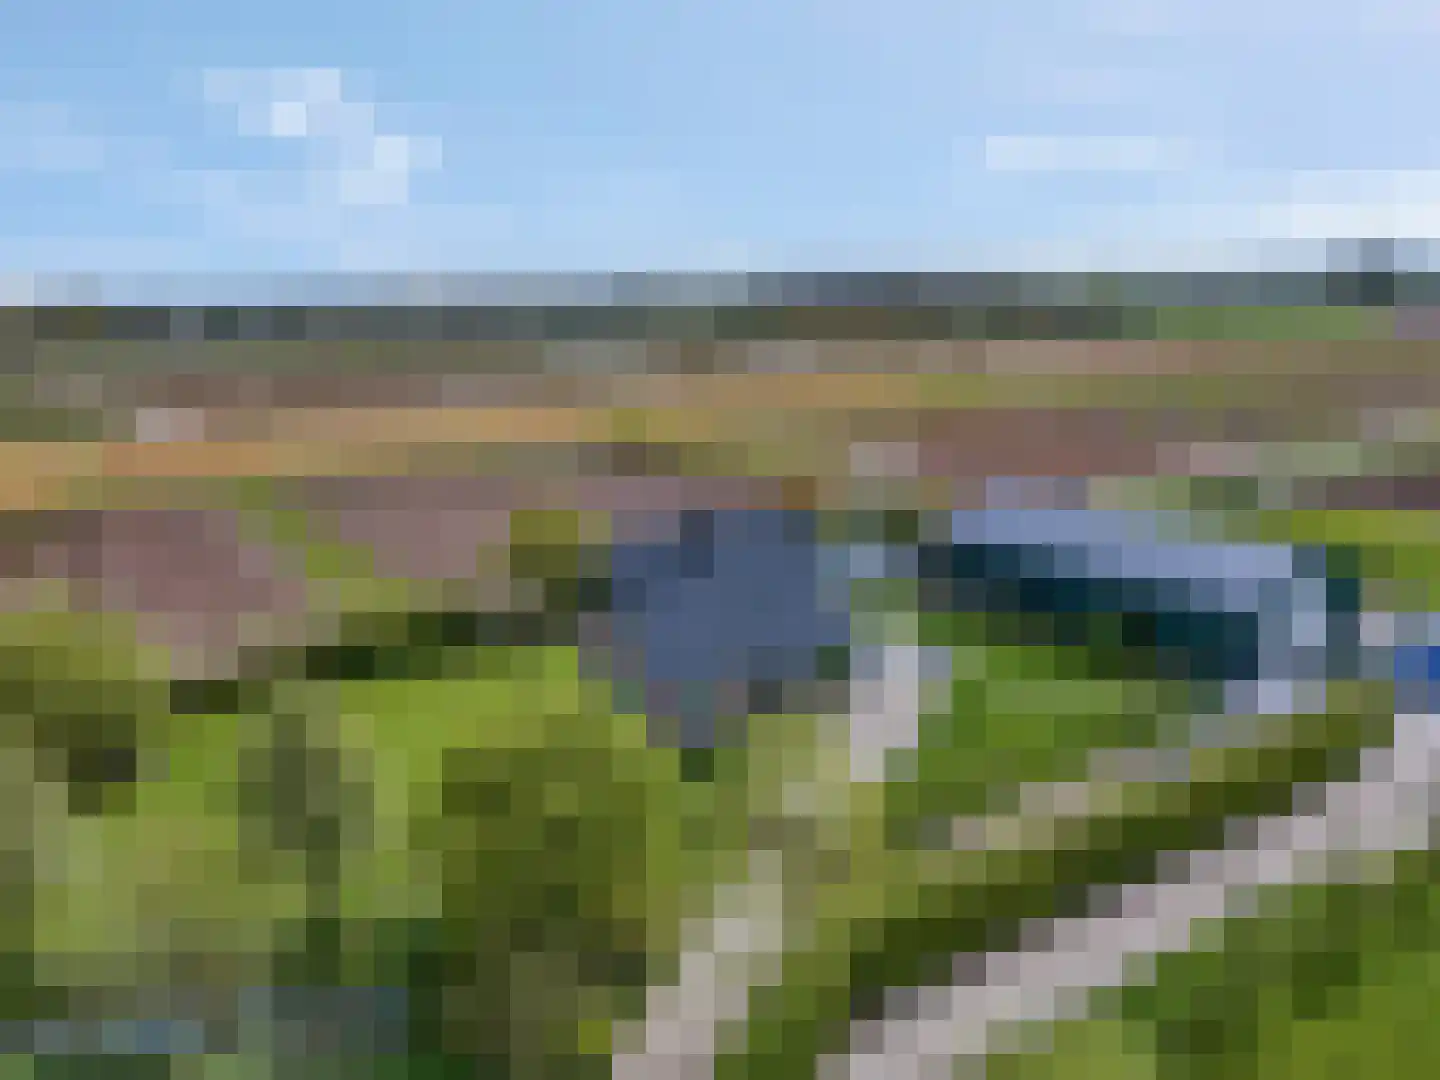
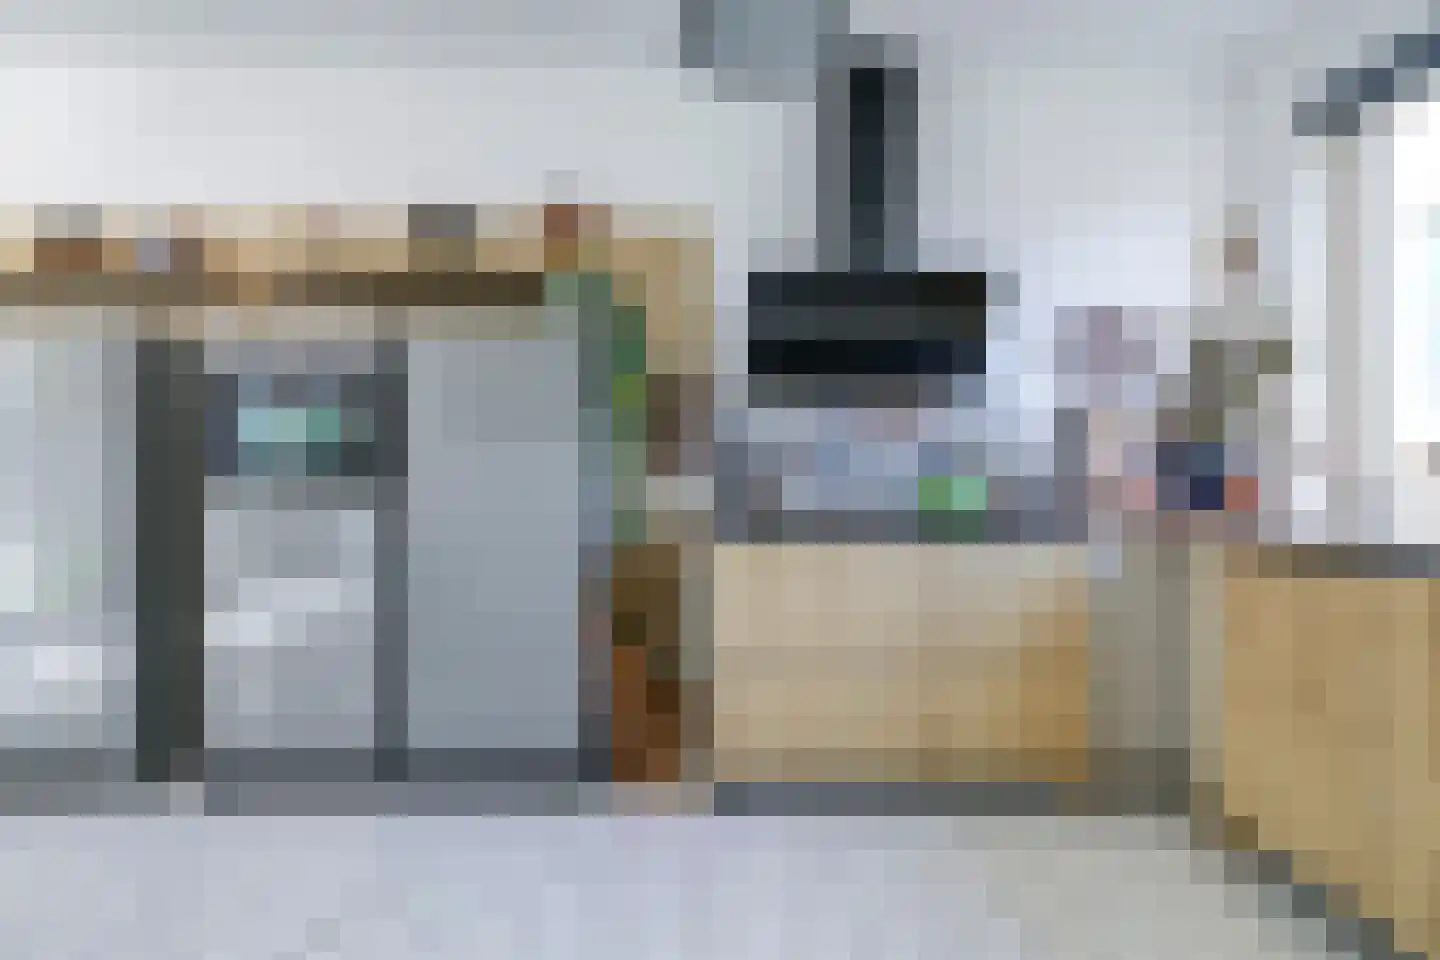
Vrijheid, ruimte en ondernemen in het buitengebied – wonen waar mogelijkheden centraal staan! Droomt u van wonen midden in het buitengebied, omringd door uitgestrekte landerijen en kwekerijen, met alle ruimte om uw agrarische activiteiten te ontplooien? Tussen Opheusden en Zetten/Randwijk ligt deze uitstekend onderhouden vrijstaande woning met agrarische bestemming op een royaal perceel van maar liefst 6.030 m². Een unieke kans voor wie zijn inkomen (hoofdzakelijk) uit agrarische activiteiten genereert en wonen en werken wil combineren op één locatie. Hier ervaart u dagelijks de rust, vrijheid en het weidse uitzicht, terwijl u beschikt over alle faciliteiten om uw bedrijfsmatige activiteiten vorm te geven. De woning, gebouwd in 2003, is in de afgelopen twee jaar grondig gemoderniseerd en volledig aangepast aan de woonwensen van nu. Comfort, sfeer en functionaliteit gaan hier moeiteloos samen. De begane grond is voorzien van een plavuizenvloer met vloerverwarming. Bij binnenkomst treft u een ruime en verzorgde hal met toilet en praktische bergkast. Het hart van de woning wordt gevormd door de sfeervolle, recent vernieuwde woonkeuken. Deze is uitgerust met hoogwaardige inbouwapparatuur, waaronder een inductiefornuis met drie ovens, een combi-magnetron, koel-vriescombinatie en vaatwasser. Het geheel is stijlvol afgewerkt met een robuust hardstenen aanrechtblad en een karaktervolle verdiepte gootsteen met gefrijnde rand. Vanuit de woonkeuken openen de dubbele deuren naar de royale veranda op het zuiden – een fantastische plek waar u in alle rust en privacy kunt genieten van lange zomeravonden en het uitzicht over uw eigen terrein. Aansluitend aan de woonkeuken bevindt zich de praktische bijkeuken met extra bergruimte. De L-vormige woonkamer aan de voorzijde van de woning biedt een warme en uitnodigende sfeer, met de houtkachel als centraal middelpunt. Op de eerste verdieping bevinden zich drie comfortabele slaapkamers. De ouderslaapkamer ligt op het zuiden en beschikt over een praktische vaste kastenwand. De overige twee kamers bevinden zich aan de voorzijde. De lichte, complete badkamer is voorzien van een wastafel, toilet, ligbad en een aparte douche. Via een vaste bordestrap bereikt u de tweede verdieping, waar zich nog twee extra kamers bevinden. Momenteel ingericht als slaapkamer en berging, maar uitermate geschikt als werkruimte, hobbykamer of extra slaapvertrekken. Buitenruimte en bedrijfsfaciliteiten: Het erf biedt volop mogelijkheden voor agrarisch gebruik. Achter en naast de loods liggen meerdere weides, ideaal voor dieren of teelt. De diepe voortuin met voormalige vijver en dierenverblijf geeft het geheel een landelijke uitstraling. De royale loods van circa 200 m² (20 x 10 meter) is een absolute meerwaarde. Deze is recent gemoderniseerd met nieuwe sandwichpanelen aan zowel wanden als dak en voorzien van vernieuwde dakgoten. Aan de zuidzijde is over de volledige lengte een overkapping gerealiseerd van circa 5 bij 20 meter – ideaal voor opslag, werkruimte of overdekt gebruik. De loods beschikt over krachtstroom, een overheaddeur en diverse functionele ruimtes, waaronder een keuken, kantoor, zitgedeelte met bar en op de verdieping nog twee multifunctionele ruimtes. Dit maakt het object bij uitstek geschikt voor agrarische ondernemers die hun activiteiten aan huis willen uitvoeren. Daarnaast bevindt zich op het terrein een fraaie, nieuwe tuinkas – perfect voor eigen teelt van groenten, bloemen of planten. Een plek met perspectief! Deze locatie biedt niet alleen een heerlijk woonklimaat, maar ook de ruimte en voorzieningen om uw agrarische onderneming verder te ontwikkelen. Een zeldzame combinatie van comfortabel wonen en functioneel werken in het buitengebied. Voor de c.v. wordt gebruik gemaakt van tankgas (propaan) omdat er geen aardgas-aansluiting is. Bent u op zoek naar een plek waar u uw agrarische toekomst kunt vormgeven, omringd door rust en ruimte? Dan laten wij u deze bijzondere locatie graag persoonlijk ervaren.
€ 975.000
Cost of copper (estimated): € 21.350
2% transfer tax (€ 19.500) + notary (€ 1.150) + valuation (€ 700)
Total purchase (incl. p.p.): € 996.350
3,21%
Yearly
€ 48.750
Direct available
Estimated mortgage
Indicative gross monthly cost
Based on annuity and 30 year term
Indicative net monthly cost
iDisclaimer: this mortgage calculation is a simplified indication based on general assumptions. No rights can be derived from the results shown. Calculated with 10-annual interest (zonder NHG), automatically determined based on the price limit € 470.000. Source: 10-jaars rente uit mortgage_rates (09-06-2026 03:45). For non-NHG, an 80% mortgage of the market value has been used in this indication.
Douche, ligbad, en toilet
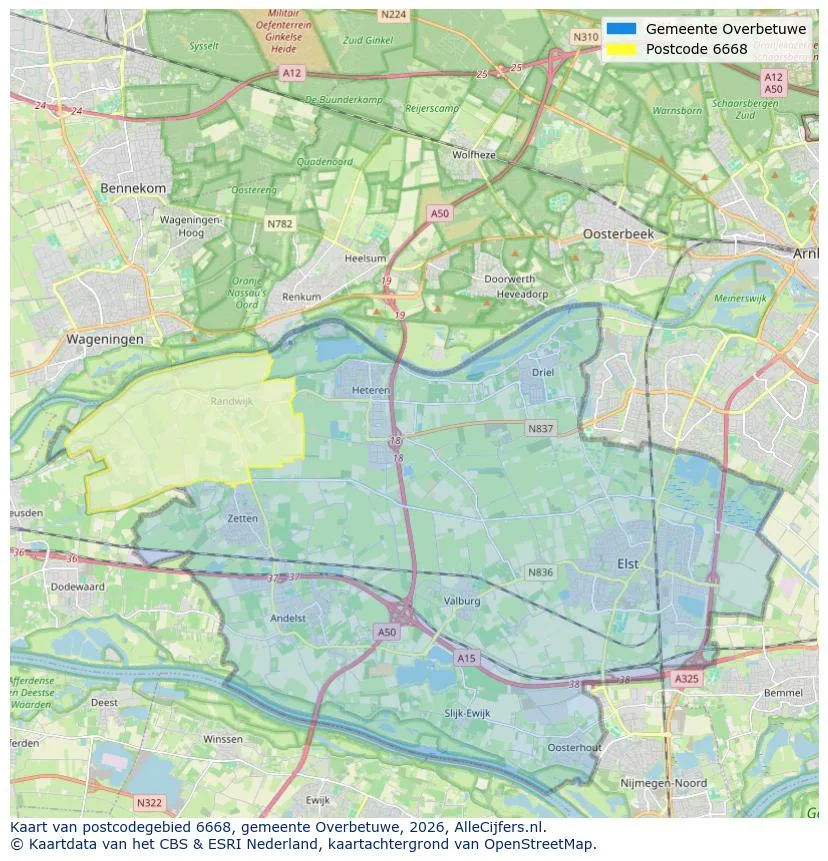
Spatial overview of the work area in Randwijk
View current location data on residents, WOZ development, housing stock, energy consumption, business activity and safety in Randwijk. In 2026 were there 1.431 residents. The average WOZ value in 2025 is EUR 425.000.
Residents
1.431
Last year: 2026
Average WOZ
EUR 425.000
Last year: 2025
Average income per person.
EUR 29.800
Source: AllNumbers
Crimes (current year)
17
Total registered
| Year | Residents |
|---|---|
| 2021 | 1.455 |
| 2022 | 1.465 |
| 2023 | 1.460 |
| 2024 | 1.465 |
| 2025 | 1.450 |
| 2026 | 1.431 |
| Year | Average WOZ |
|---|---|
| 2021 | EUR 301.000 |
| 2022 | EUR 329.000 |
| 2023 | EUR 394.000 |
| 2024 | EUR 409.000 |
| 2025 | EUR 425.000 |
Hoger
370
Praktisch
270
Middelbaar
470
Europa
45
Nederland
1.320
Buiten Europa
90
Label C
130
Label B
108
Label G
74
Label A
66
Label F
64
Label D
54
Label E
25
Label A+
2
Label A++
2
Label A+++
1
Label A++++
0
Label A+++++
0
| Year | Gas (m3) | Electricity (kWh) |
|---|---|---|
| 2020 | 1.510 | 3.500 |
| 2021 | 1.700 | 3.580 |
| 2022 | 1.290 | 3.400 |
| 2023 | 1.020 | 3.210 |
| 2024 | 1.020 | 3.390 |
Hoekwoning
Gas: 860 • Electricity: 2.560
Huurwoning
Gas: 890 • Electricity: 2.320
Koopwoning
Gas: 1.070 • Electricity: 3.560
Appartement
Gas: 900 • Electricity: 3.240
Tussenwoning
Gas: 850 • Electricity: 2.670
Vrijstaande woning
Gas: 1.230 • Electricity: 3.790
Twee-onder-één-kap woning
Gas: 850 • Electricity: 2.970
Total number of company establishments: 235
| Period | Crimes |
|---|---|
| jan 2026 | 1 |
| jul 2025 | 1 |
| jun 2025 | 1 |
| mei 2025 | 0 |
| mrt 2025 | 3 |
| mrt 2026 | 0 |
| nov 2024 | 3 |
| nov 2025 | 0 |
| okt 2024 | 0 |
| okt 2025 | 1 |
| sep 2024 | 1 |
| sep 2025 | 2 |
These figures give an indicative picture of safety trends in the living environment of Randwijk.
Short answers based on current local statistics, handy for a quick comparison of the living environment.
Randwijk telt in 2026 ongeveer 1.431 inwoners.
De gemiddelde WOZ-waarde in Randwijk is in 2025 circa € 425.000.
Het gemiddelde inkomen per inwoner in Randwijk ligt rond € 29.800 per jaar.
Voor het huidige jaar gaat het om ongeveer 17 geregistreerde misdrijven. Gebruik deze cijfers als indicatie en vergelijk trends per periode.
In Randwijk komt vooral "Vrijstaande woningen" veel voor, met ongeveer 237 woningen.
View more homes in this location.
6668AH Randwijk
€ 550.000 k.k.
€ 4.074/m²

6668CC Randwijk
€ 489.000 k.k.
€ 4.405/m²

6668CA Randwijk
€ 499.000 k.k.
€ 0/m²

6668AD Randwijk
€ 550.000 k.k.
€ 5.045/m²

6668AB Randwijk
€ 975.000 k.k.
€ 4.372/m²
