Residents
48.070
Last year: 2026
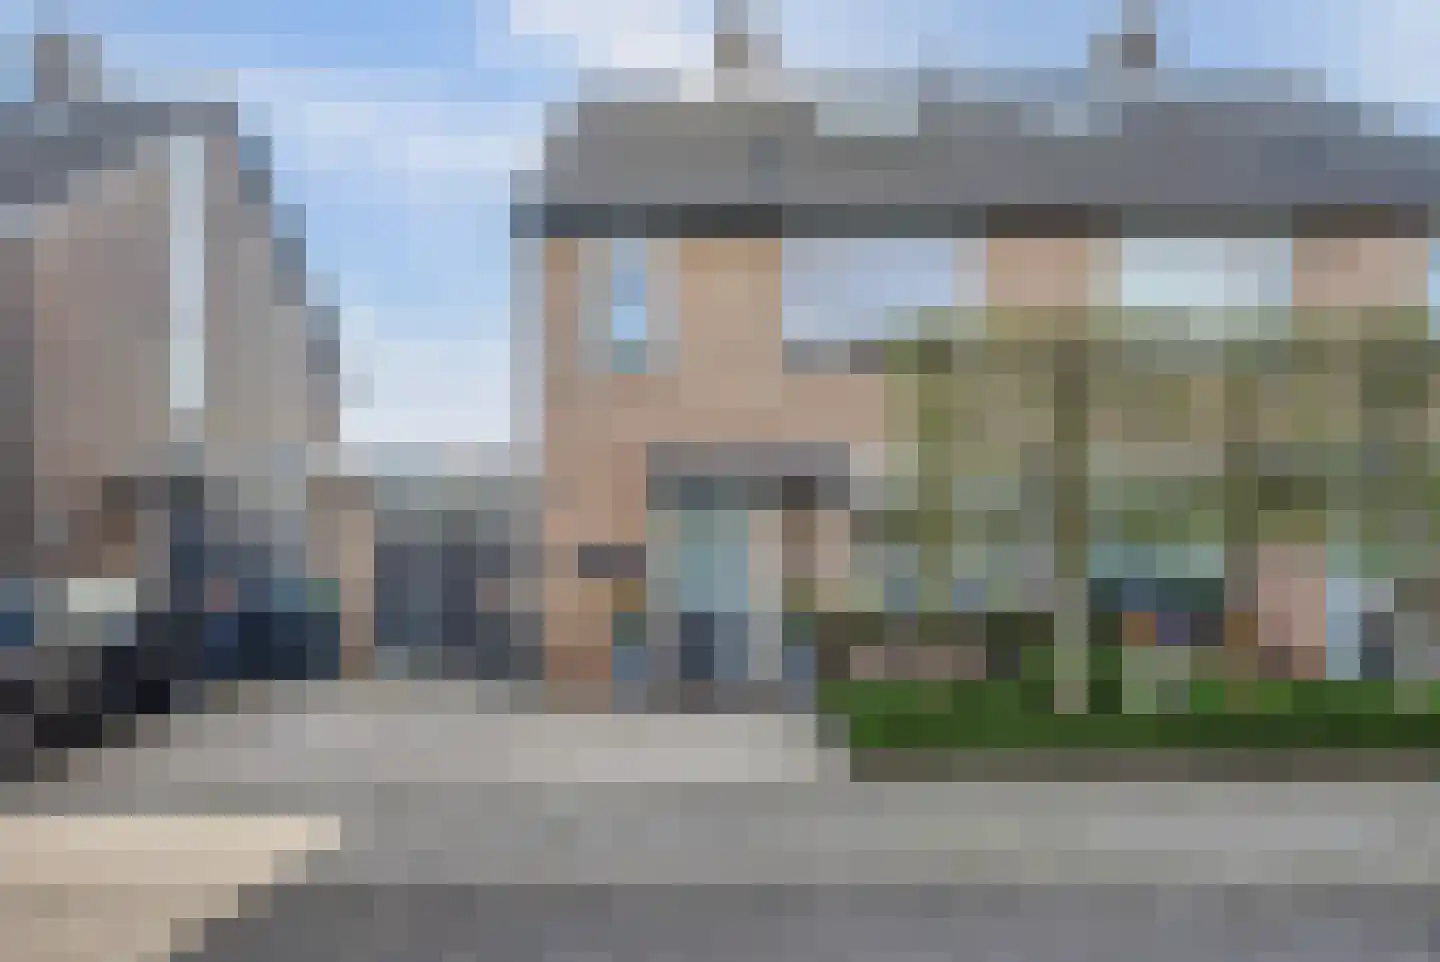
2986SB Ridderkerk • Zuid-Holland
€ 590.000 k.k.
Cost of copper (estimated): € 13.650
2% transfer tax (€ 11.800) + notary (€ 1.150) + valuation (€ 700)
Total incl. VAT: € 603.650
Purchase price /m²: € 4.155
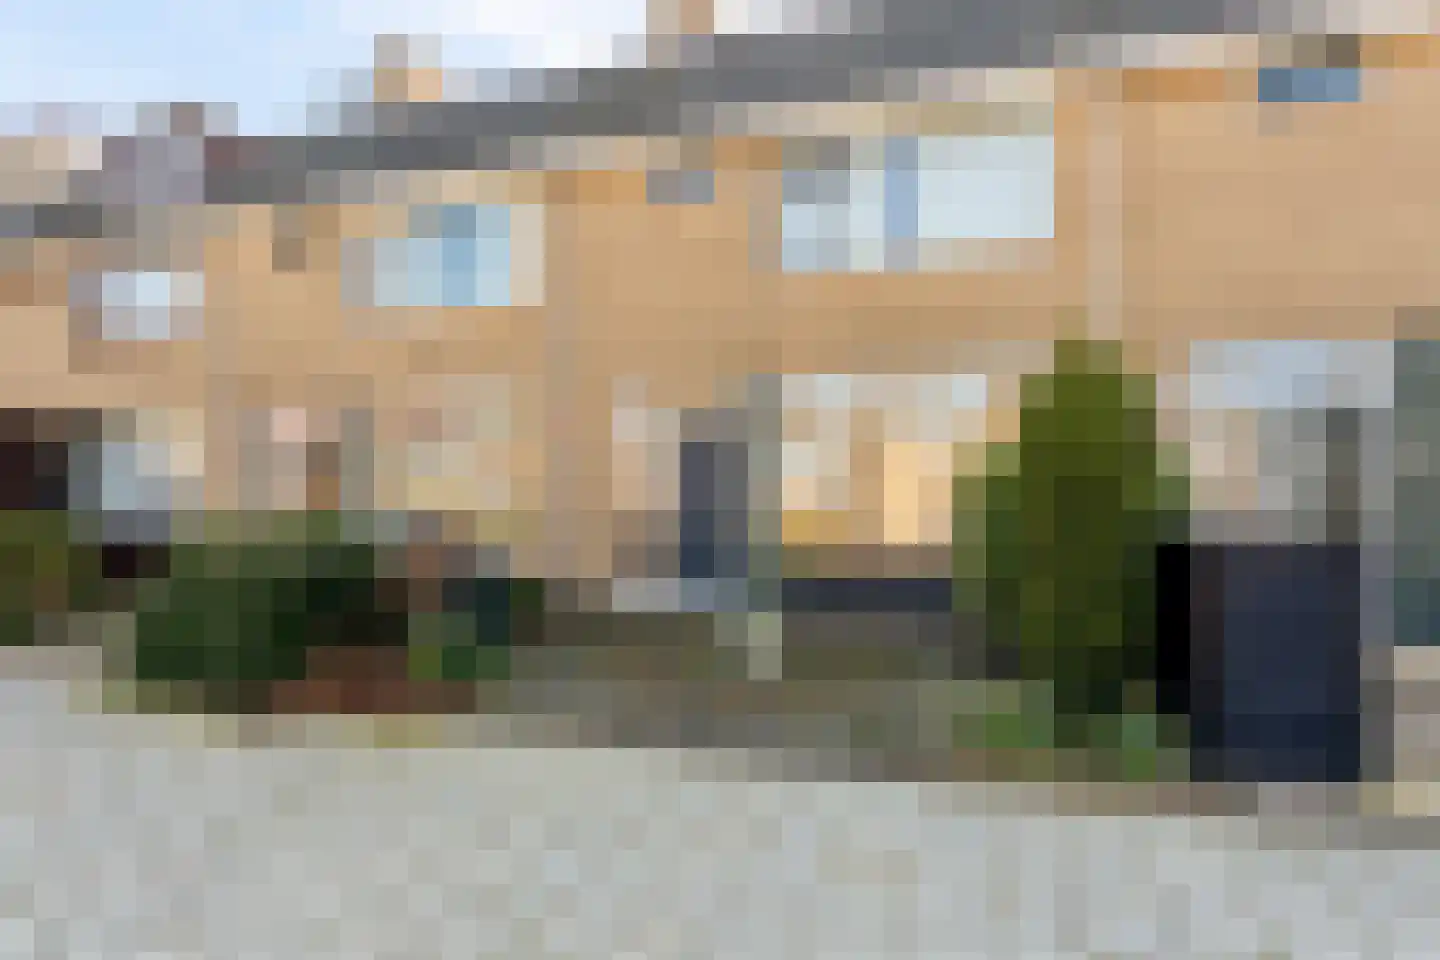
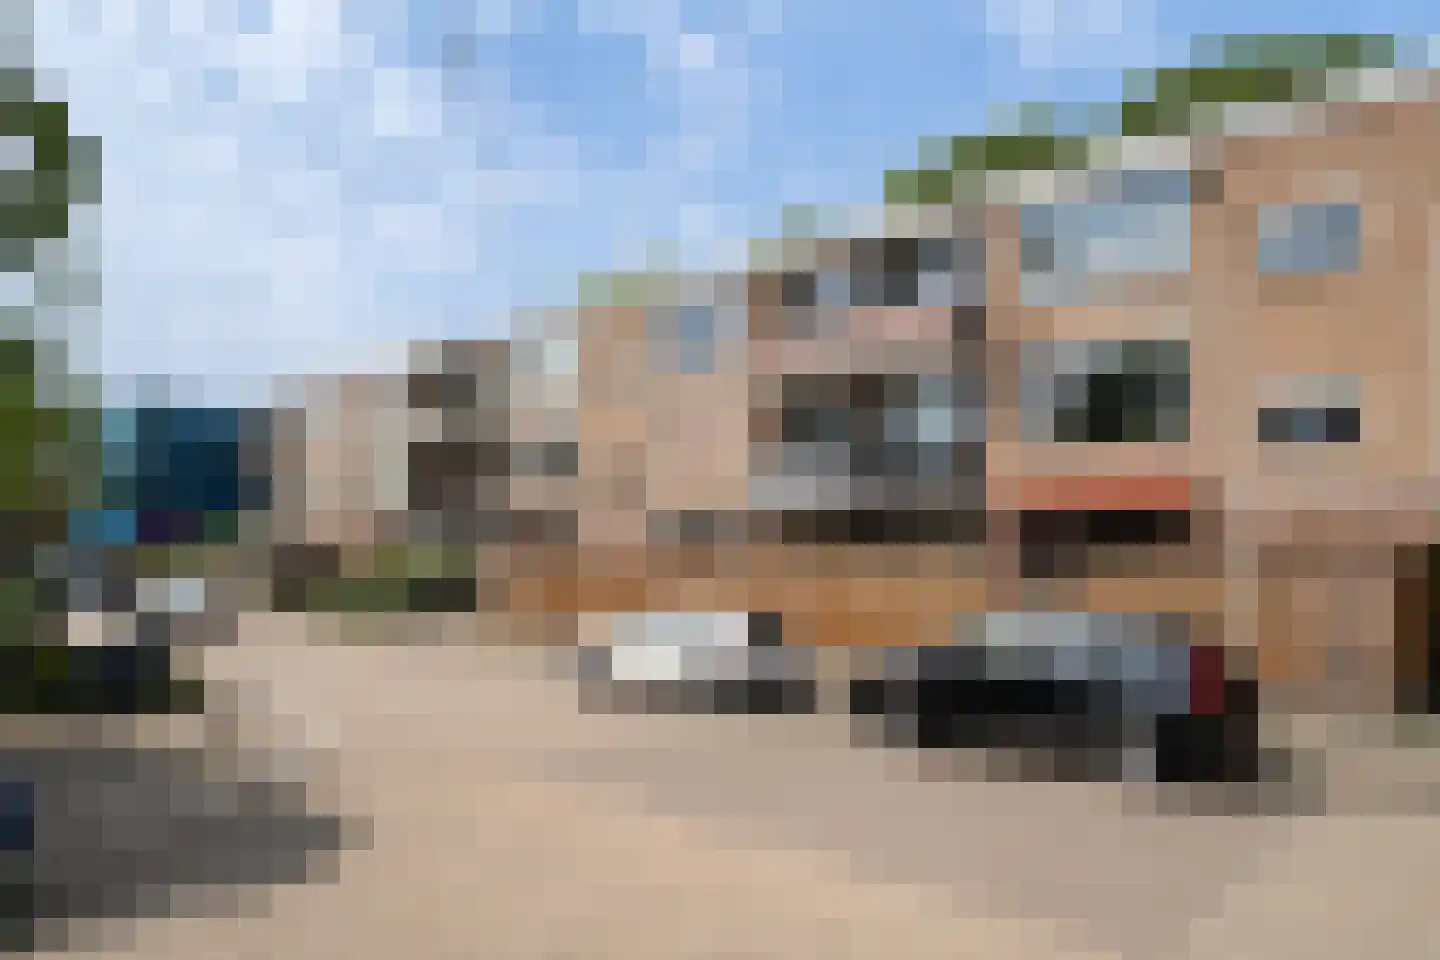
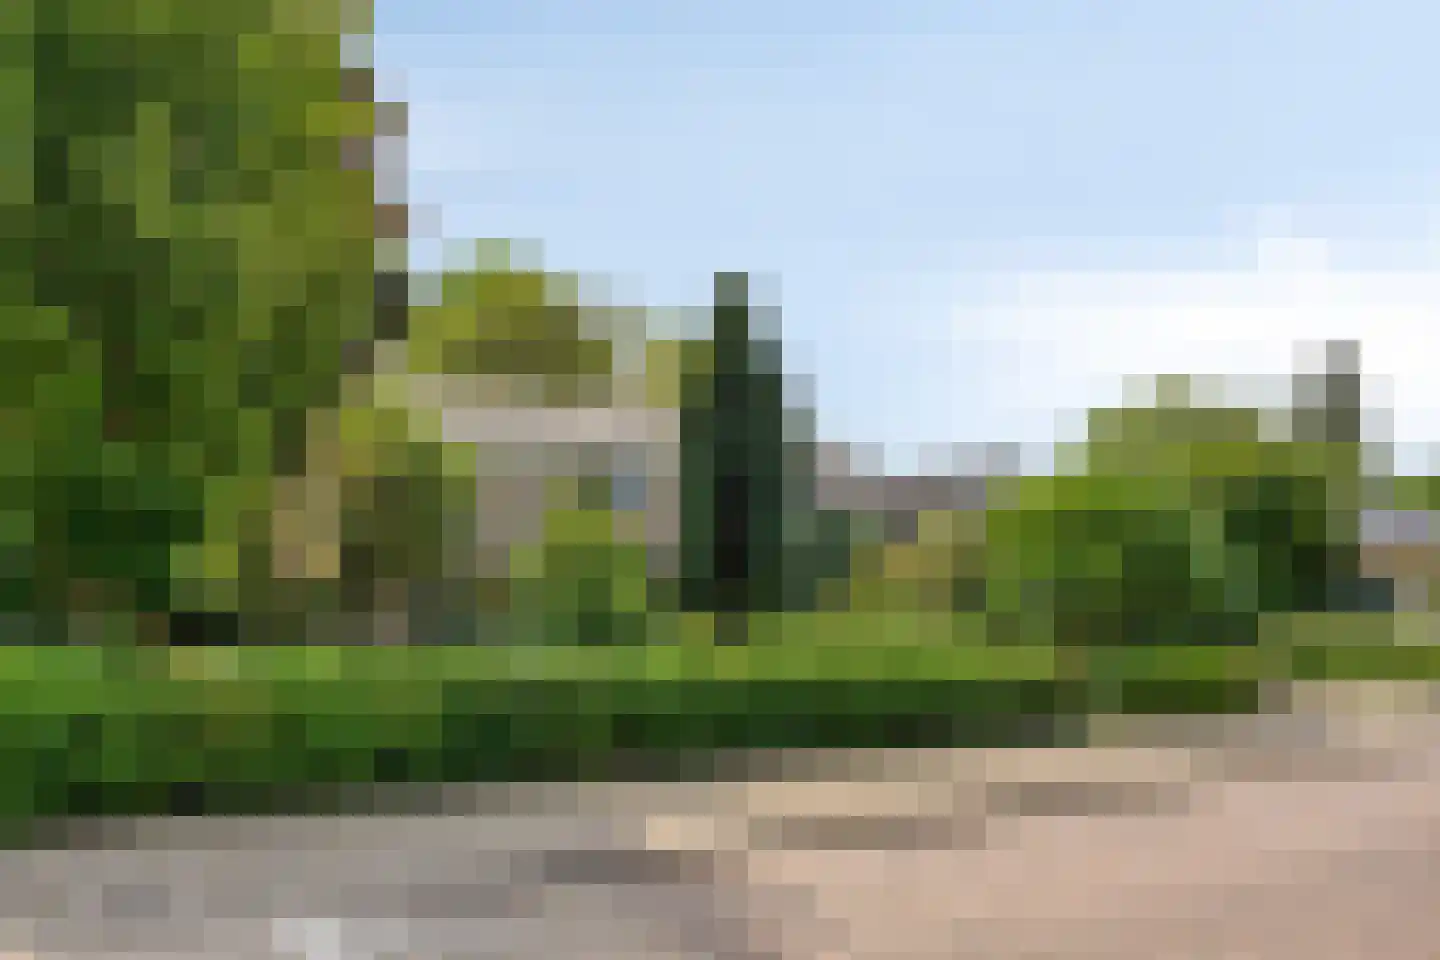
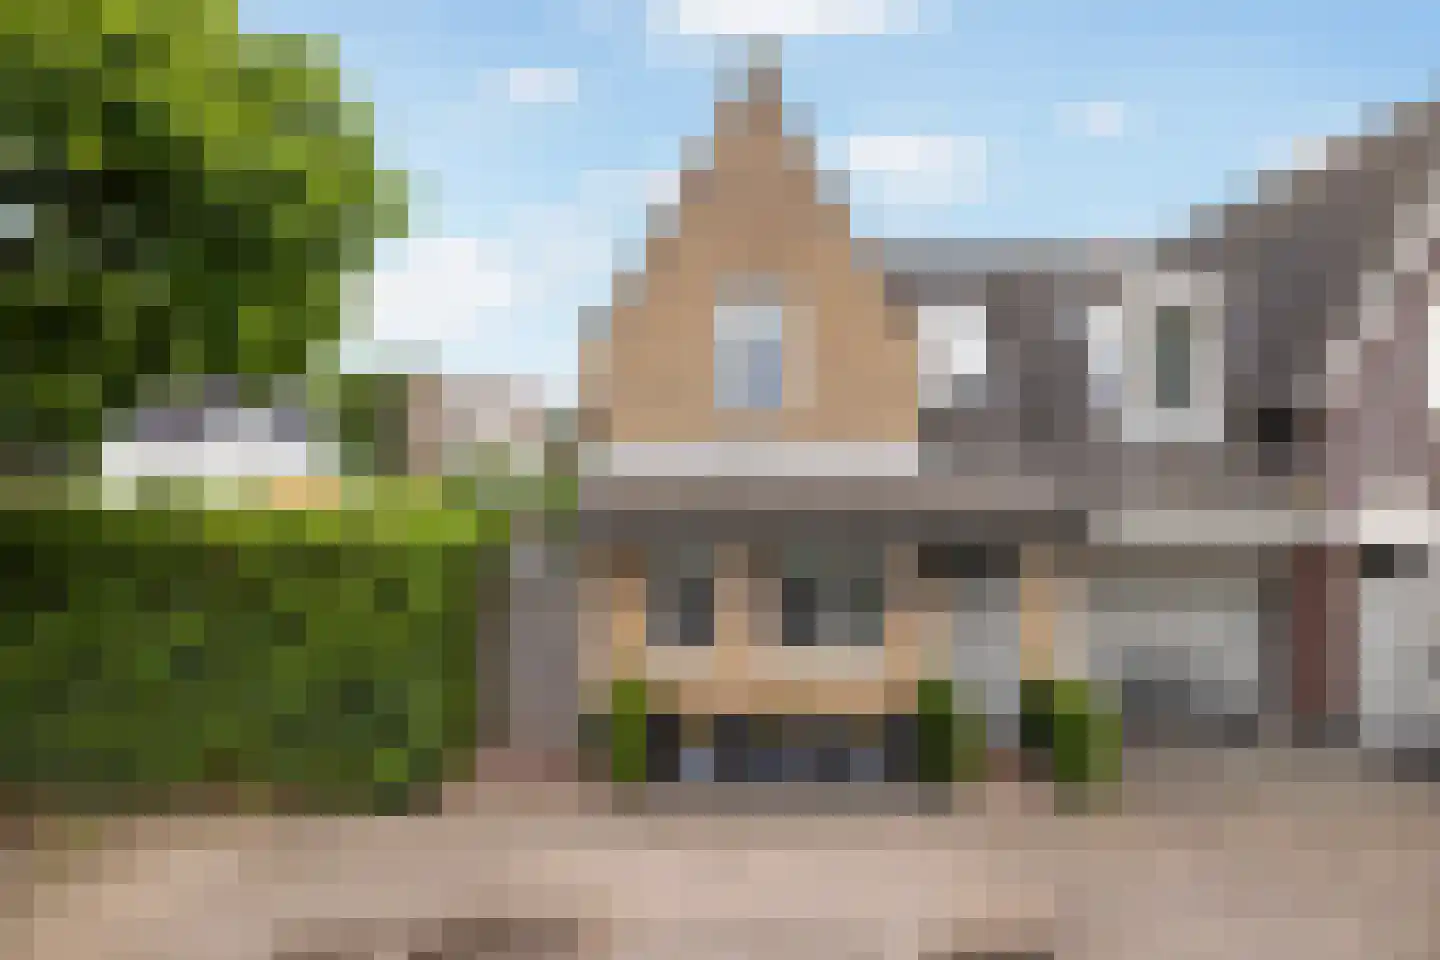
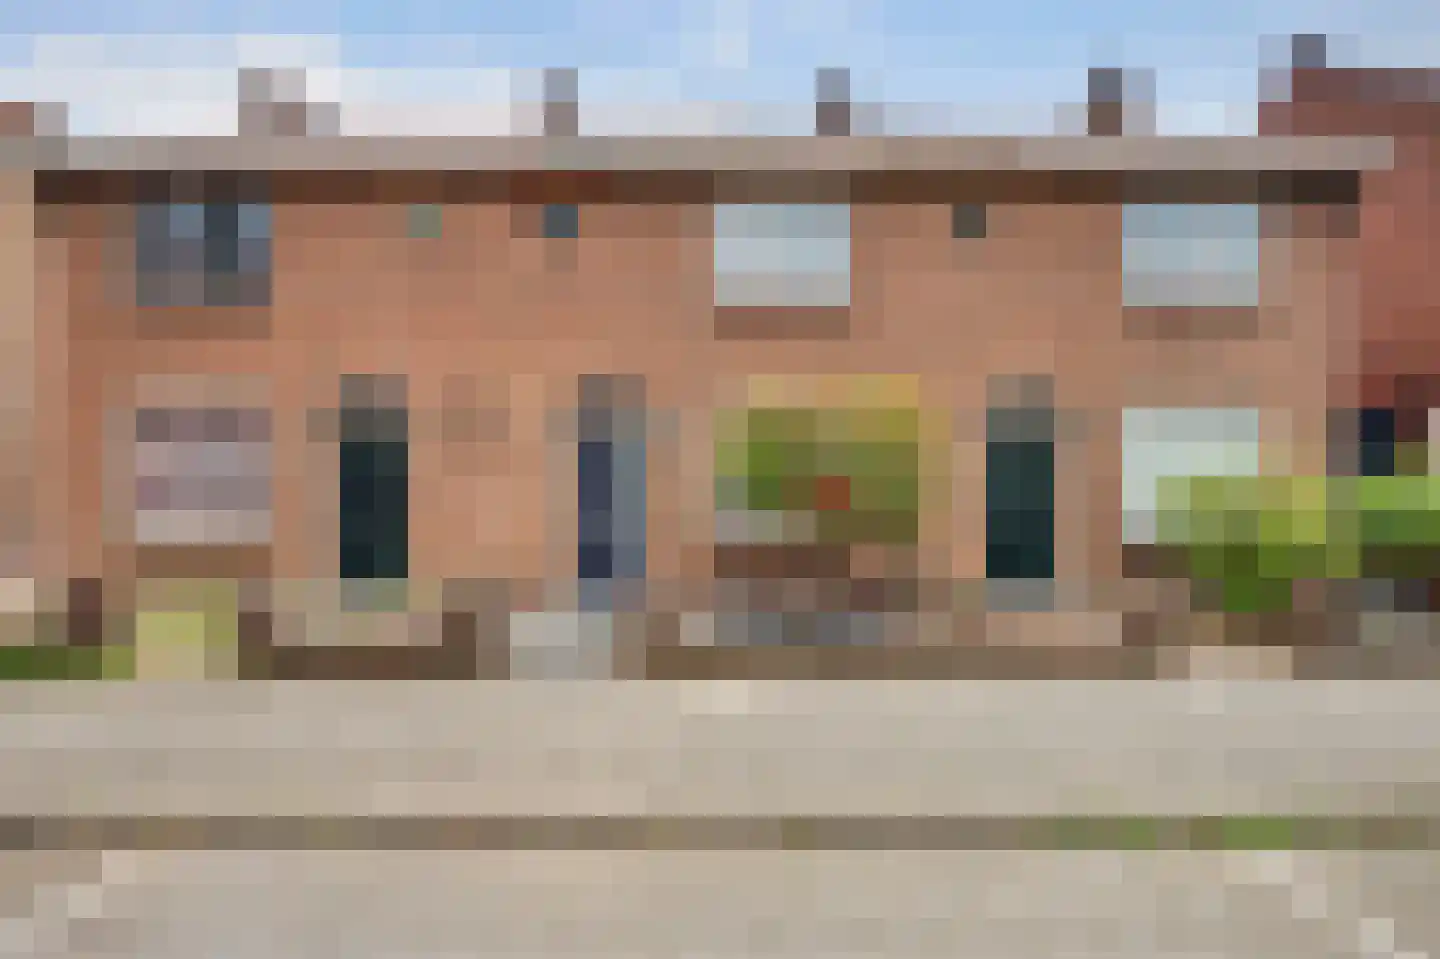
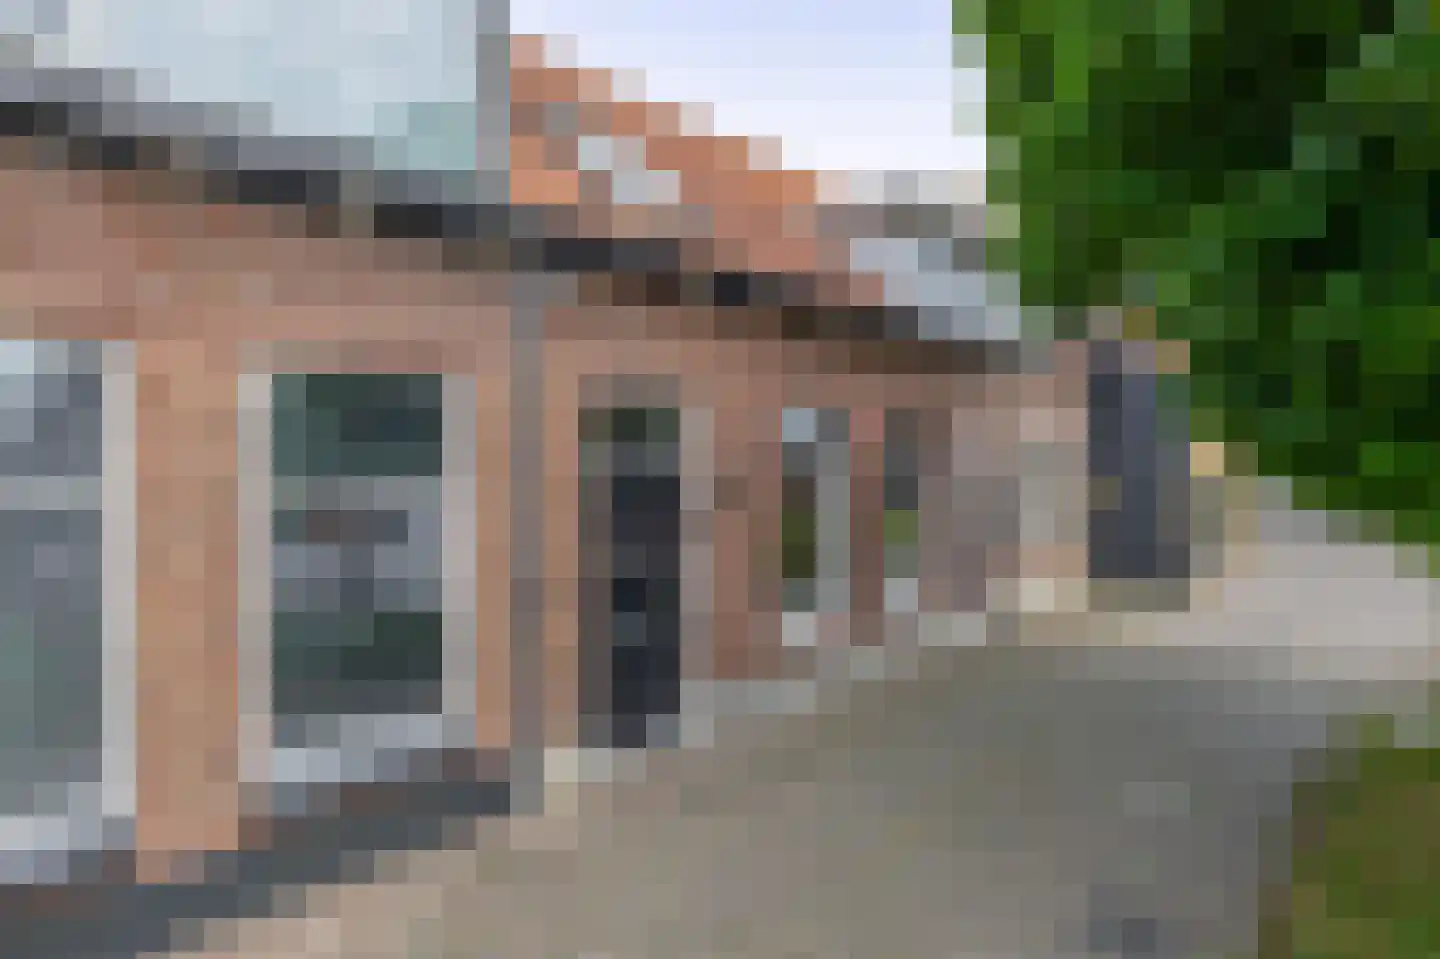
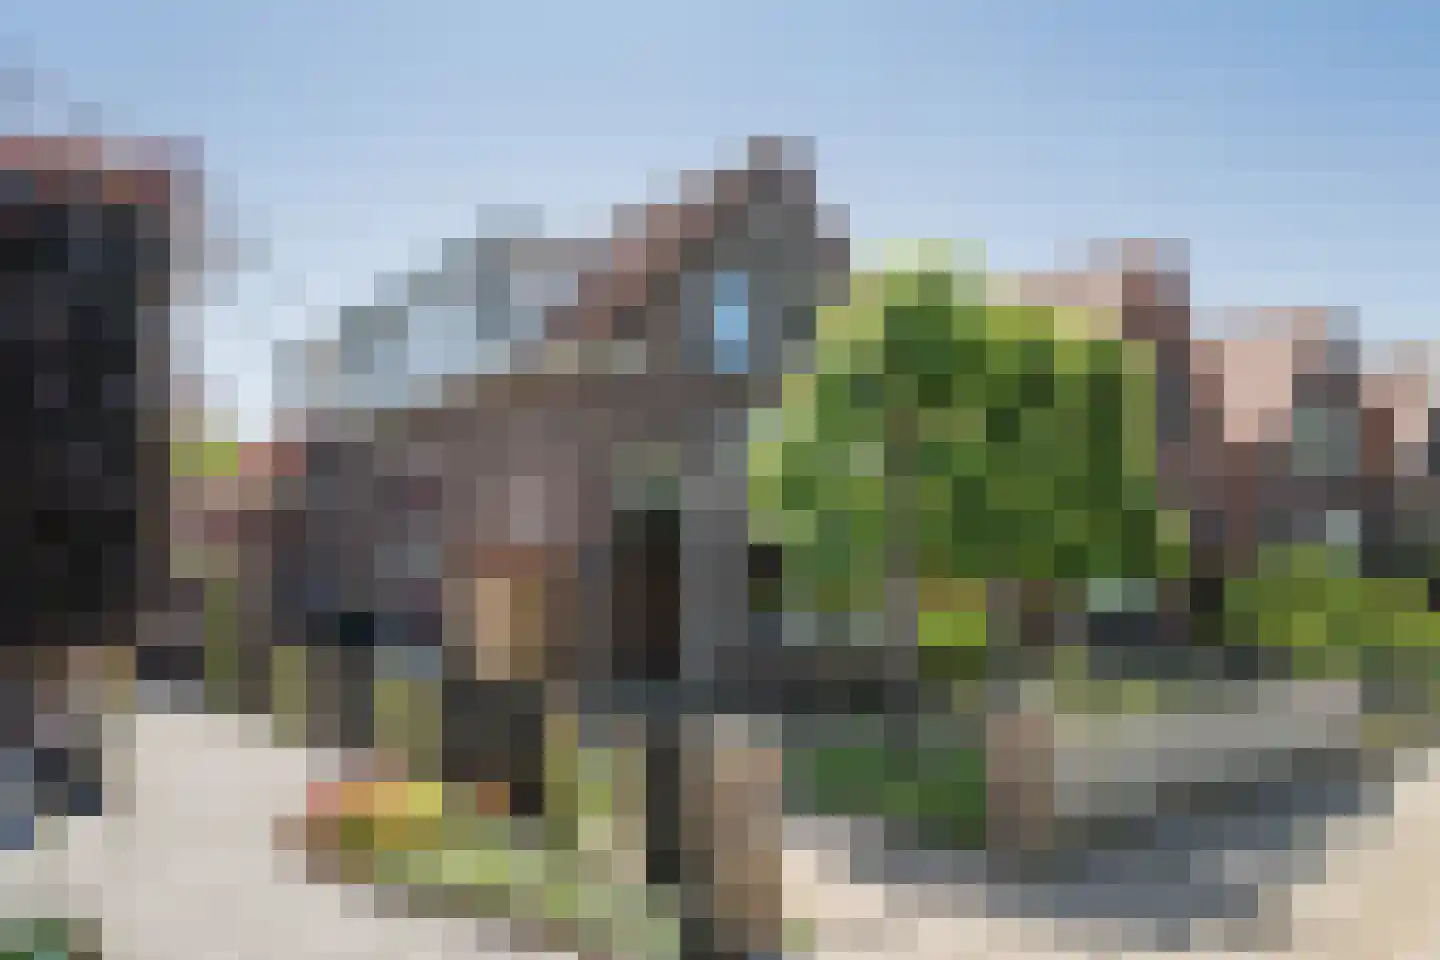
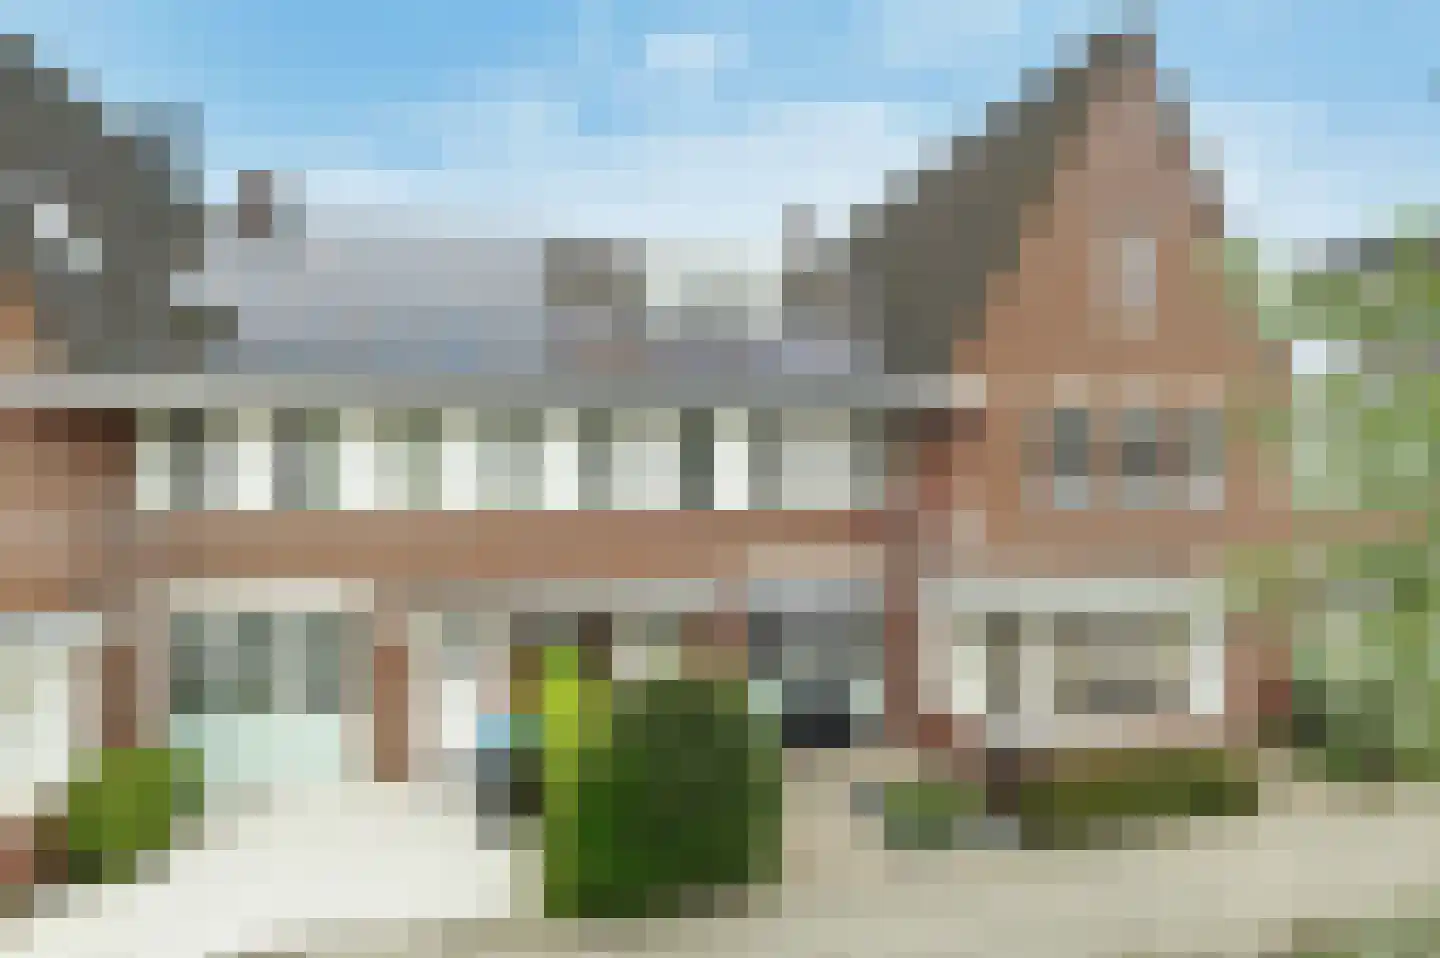
Op zoek naar een twee-onder-één-kapwoning in de wijk Drievliet? Zoek dan niet verder! Deze 142 m2 grote tweekapper uit 1988 is gelegen aan een doodlopende straat, heeft een eigen oprit, is geheel voorzien van kunststof kozijnen met isolatieglas en heeft een aanbouw en een dakkapel aan de achterzijde. Wij laten je graag deze goed onderhouden woning zien! De woning heeft zowel aan de voor- als aan de achterzijde een zeer fraai aangelegde tuin, met groene bordes, kunstgras en sierbestrating. De achtertuin is gelegen op het zuidoosten. In de achtertuin, tegen de achtergevel aan, is een heerlijke overkapping gecreëerd, die je bereikt via de schuifpui in de woonkamer. In de achtertuin is ook een houten berging te vinden. De voortuin heeft een eigen plek voor het parkeren van je auto; hoe fijn is dat! De voormalige garage is omgebouwd tot een ruime berging die vanuit de hal te bereiken is en een deel van de garage is bij de woonkamer getrokken. Dit, tezamen met de aanbouw, zorgt toch wel voor een hele mooie living! Verder biedt deze vijfkamerwoning een open keukenruimte aan de voorzijde, een moderne badkamer en vier ruime slaapkamers. Dankzij de kunststof kozijnen met HR++ glas en de isolatie van het dak, vloer en gevels is de woning niet alleen comfortabel, maar ook duurzaam. Deze woning heeft energielabel B. De woning is volledig voorzien van kunststof kozijnen en volledig uitgerust met isolatieglas, wat bijdraagt aan een comfortabel woonklimaat en lage energielasten. De woning is gelegen in een gemoedelijke, doodlopende straat in een kindvriendelijke wijk, met een speeltuin op korte afstand. In de nabije omgeving bevinden zich diverse voorzieningen, waaronder winkelplein Vlietplein, basisscholen, sportfaciliteiten, openbaar vervoer en de uitvalswegen richting omliggende steden. Maar ook het groen ligt op loopafstand. Wil je wandelen of fietsen door de Gorzen, de Crezéepolder of liever door het Oosterpark, ze bevinden zich alle op korte afstand van deze woning. Indeling: Begane grond: Entree: Lichte hal met de garderoberuimte, de meterkast (9 groepen met aardlekschakelaar en een tweefase kookgroep) en toegang tot de berging, het toilet, de woonkamer en de trapopgang naar de eerste verdieping. De vloer is hier, net als in de woonkamer, afgewerkt met plavuizen met vloerverwarming. De wanden zijn voorzien van spachtelputz. Toilet: De moderne toiletruimte is geheel betegeld in een wit-antraciet kleurstelling en voorzien van een hangend toilet, een fonteintje, een klein kiepraam en een moderne houten plank boven het inbouwreservoir. Berging: Vanuit de hal is de toegang tot de berging welke voorheen de garage was. In de berging bevindt zich de wasmachine- en drogeraansluiting. Tevens is er een spoelbak aanwezig, die van warmwater is voorzien middels een close-in boiler. Woonkamer: De ruime en speelse woonkamer geeft bij binnenkomst direct een sfeervol gevoel. De uitbouw, de grote schuifpui en de aangrenzende overkapping dragen hier aan bij. Zo zet je ook op de minder mooie dagen gemakkelijk de schuifpui open en kan je genieten van een overdekt en windvrij zitgedeelte. In de zithoek zorgt de gashaard voor extra sfeer en comfort. Onder de het trapgedeelte bevindt zich een praktische bergkast, welke toegankelijk is vanuit de woonkamer. Op de plaats van de voormalige garage en de uitbouw is de eetkamer gecreëerd, welke indien gewenst ook een andere bestemming kan krijgen, zoals bijvoorbeeld een werkkamer of speelkamer voor de kinderen. Door de vele raampartijen heeft de woonkamer veel lichtinval en is het een fijne plek om te verblijven. De vloer in de gehele woonkamer is afgewerkt met plavuizen en vloerverwarming. Er is een convectorput aanwezig voor de schuifpui. De wanden zijn afgewerkt met sierpleister en het plafond is voorzien van spuitwerk. Keuken: Vanuit de woonkamer kom je in de open keukenruimte aan de voorzijde van de woning. De keuken is geplaatst in een U-vormige opstelling. Het keukenblok heeft een crème kleurstelling en is voorzien van een fraai natuurstenen aanrechtblad. De aanwezige voorzieningen in de keuken bestaan uit een spoelbak, Quooker, vaatwasser, 5 pits-inductiekookplaat, combimagnetron, separate oven, koelkast en een vlakschouw-afzuigkap. Vanuit de keuken kijk je leuk weg door de straat. Eerste verdieping: Overloop: De centrale overloop is voorzien van een zijraam waardoor deze ruimte ene lichte indruk geeft. De vloer is voorzien van PVC en wanden zijn afgewerkt met sierpleister. Vanaf de overloop heb je toegang tot de badkamer en 3 slaapkamers. Via een vaste trap bereik je de zolderverdieping. Zoals door het hele huis, zijn ook op deze verdieping (overloop, badkamer, slaapkamers) alle kozijnen van kunststof met HR++ beglazing. Slaapkamers: Er bevinden zich 3 ruime slaapkamers op de eerste verdieping, welke allen zijn afgewerkt met een PVC-vloer, deels gestucte en deels behangen wanden en spuitwerk plafonds met sierlijsten. Voor alle draaiende ramen zijn horren aanwezig. Badkamer: De luxe en moderne badkamer is ingedeeld met een doucheruimte met glazen deur en Sunshower, hangend toilet, designradiator, wastafel met bijbehorend meubel en een spiegelkast. Deze ruimte is geheel betegeld in een grijs-witte kleurstelling en is voorzien van een raam, zodat er geventileerd kan worden. Tweede verdieping: Voorzolder: Via een vast trap bereik je de voorzolder. Deze overloop is ruim en netjes afwerkt met een laminaatvloer die doorloopt over de gehele zolderetage. Hier bevinden zich hier twee vaste bergkasten en een afgesloten ruimte met daarin de CV-combiketel (Remeha Avanta, bouwjaar 2015). Het zijraam zorgt voor extra daglicht. Slaapkamer: De vierde slaapkamer is ruim bemeten en voorzien van dakkapel aan de achterzijde en een Velux-dakraam aan de voorzijde. Hierdoor is het een prettige en lichte kamer. In het plafond heeft men inbouwverlichting en onder de schuine kap zijn knieschotten te vinden. De wanden in deze kamer zijn afgewerkt met glasvliesbehang. Vanuit de slaapkamer is er toegang tot een bergzolder. Buiten: De voor- en de achtertuin ogen zeer verzorgd en zijn ruim bemeten. De voortuin is voorzien van sierbestrating met groene bordes en een eigen oprit. Vanaf de oprit is er ook een aparte toegangsdeur tot de berging. Ook dit kozijn is geheel van kunststof! De op het zuidoosten gelegen achtertuin is net zo fraai en groen aangelegd als de voortuin en is bereikbaar via de schuifpui in de woonkamer. Doordat er geen directe achterburen zijn, geniet je van een enorme hoeveelheid privacy! De achtertuin biedt meer dan voldoende ruimte om te genieten in de zon of in de schaduw, al naar gelang jouw wens. Een groot pluspunt van de achtertuin is de fijne overkapping, waar je heerlijk kan zitten en welke aan drie zijden is afgesloten van wind, waardoor je langer van het buitenleven kan genieten. In het dak van de overkapping bevinden zich lichtkoepels welke voor extra licht inval zorgen. De overkapping is voorzien van elektra en een straalkachel, waardoor deze echt voelt als een verlenging van je woonkamer! Bijzonderheden: • Bouwjaar 1988 • Gelegen in de wijk Drievliet van Ridderkerk, in een doodlopende en rustige straat • Centraal gelegen woning ten opzichte van alle denkbare voorzieningen • Goed geïsoleerde woning met energielabel B, geldig tot 14 april 2036 • CV-combiketel Remeha Calenta CW5 bouwjaar 2015, jaarlijks onderhouden, eigendom • 201 m2 eigen grond • Geheel voorzien van kunststof kozijnen met HR++ beglazing • Spouwmuren nageïsoleerd (ingespoten) Oplevering: In overleg Deze informatie is door ons met de nodige zorgvuldigheid samengesteld. Er wordt echter geen enkele aansprakelijkheid aanvaard voor enige onvolledigheid, onjuistheid of anderszins, dan wel de gevolgen daarvan. Alle opgegeven maten en oppervlakten zijn indicatief. Van toepassing zijn de Algemene Consumentenvoorwaarden Makelaardij NVM. Voor onze privacyverklaring verwijzen wij u naar onze website.
€ 590.000
Cost of copper (estimated): € 13.650
2% transfer tax (€ 11.800) + notary (€ 1.150) + valuation (€ 700)
Total purchase (incl. p.p.): € 603.650
3,21%
Yearly
€ 29.500
Direct available
Estimated mortgage
Indicative gross monthly cost
Based on annuity and 30 year term
Indicative net monthly cost
iDisclaimer: this mortgage calculation is a simplified indication based on general assumptions. No rights can be derived from the results shown. Calculated with 10-annual interest (zonder NHG), automatically determined based on the price limit € 470.000. Source: 10-jaars rente uit mortgage_rates (08-06-2026 03:45). For non-NHG, an 80% mortgage of the market value has been used in this indication.
Douche, toilet, wastafel, en wastafelmeubel
Explore Ridderkerk and the surrounding areas
View current location data on residents, WOZ development, housing stock, energy consumption, business activity and safety in Ridderkerk. In 2026 were there 48.070 residents. The average WOZ value in 2025 is EUR 346.000.
Residents
48.070
Last year: 2026
Average WOZ
EUR 346.000
Last year: 2025
Average income per person.
EUR 32.800
Source: AllNumbers
Crimes (current year)
1.807
Total registered
| Year | Residents |
|---|---|
| 2022 | 47.099 |
| 2023 | 47.477 |
| 2024 | 47.721 |
| 2025 | 47.999 |
| 2026 | 48.070 |
| Year | Average WOZ |
|---|---|
| 2021 | EUR 257.000 |
| 2022 | EUR 285.000 |
| 2023 | EUR 330.000 |
| 2024 | EUR 342.000 |
| 2025 | EUR 346.000 |
Hoger
24
Praktisch
31
Middelbaar
45
Europa
2.917
Nederland
35.759
Buiten Europa
9.323
Label C
6.571
Label A
4.786
Label B
3.788
Label E
2.238
Label D
1.964
Label G
1.137
Label F
1.016
Label A+++
591
Label A+
367
Label A++++
165
Label A++
108
Label A+++++
41
| Year | Gas (m3) | Electricity (kWh) |
|---|---|---|
| 2020 | 1.000 | 2.770 |
| 2021 | 1.140 | 2.820 |
| 2022 | 870 | 2.670 |
| 2023 | 750 | 2.510 |
| 2024 | 740 | 2.550 |
Hoekwoning
Gas: 930 • Electricity: 2.840
Huurwoning
Gas: 650 • Electricity: 2.050
Koopwoning
Gas: 830 • Electricity: 2.860
Appartement
Gas: 560 • Electricity: 2.040
Tussenwoning
Gas: 780 • Electricity: 2.610
Vrijstaande woning
Gas: 1.460 • Electricity: 4.240
Twee-onder-één-kap woning
Gas: 1.020 • Electricity: 3.250
Total number of company establishments: 5.895
| Period | Crimes |
|---|---|
| jan 2025 | 126 |
| jan 2026 | 189 |
| jul 2025 | 187 |
| jun 2025 | 151 |
| mei 2025 | 144 |
| mrt 2025 | 147 |
| nov 2024 | 134 |
| nov 2025 | 176 |
| okt 2024 | 180 |
| okt 2025 | 157 |
| sep 2024 | 149 |
| sep 2025 | 138 |
These figures give an indicative picture of safety trends in the living environment of Ridderkerk.
Short answers based on current local statistics, handy for a quick comparison of the living environment.
Ridderkerk telt in 2026 ongeveer 48.070 inwoners.
De gemiddelde WOZ-waarde in Ridderkerk is in 2025 circa € 346.000.
Het gemiddelde inkomen per inwoner in Ridderkerk ligt rond € 32.800 per jaar.
Voor het huidige jaar gaat het om ongeveer 1.807 geregistreerde misdrijven. Gebruik deze cijfers als indicatie en vergelijk trends per periode.
In Ridderkerk komt vooral "Appartementen" veel voor, met ongeveer 9.916 woningen.
View more homes in this location.
2987TD Ridderkerk
€ 389.000 k.k.
€ 3.325/m²
2981CP Ridderkerk
€ 300.000 k.k.
€ 4.000/m²
2981BD Ridderkerk
€ 1.100.000 k.k.
€ 3.833/m²
2988BJ Ridderkerk
€ 519.000 k.k.
€ 5.521/m²
2983HD Ridderkerk
€ 375.000 k.k.
€ 5.068/m²
2989AC Ridderkerk
€ 368.800 k.k.
€ 4.191/m²
2985AR Ridderkerk
€ 580.000 k.k.
€ 5.421/m²
2983SN Ridderkerk
€ 475.000 k.k.
€ 4.358/m²
