Residents
1.516
Last year: 2026
6116AS Roosteren • Limburg
€ 499.000 k.k.
Cost of copper (estimated): € 11.830
2% transfer tax (€ 9.980) + notary (€ 1.150) + valuation (€ 700)
Total incl. VAT: € 510.830
Purchase price /m²: € 2.697
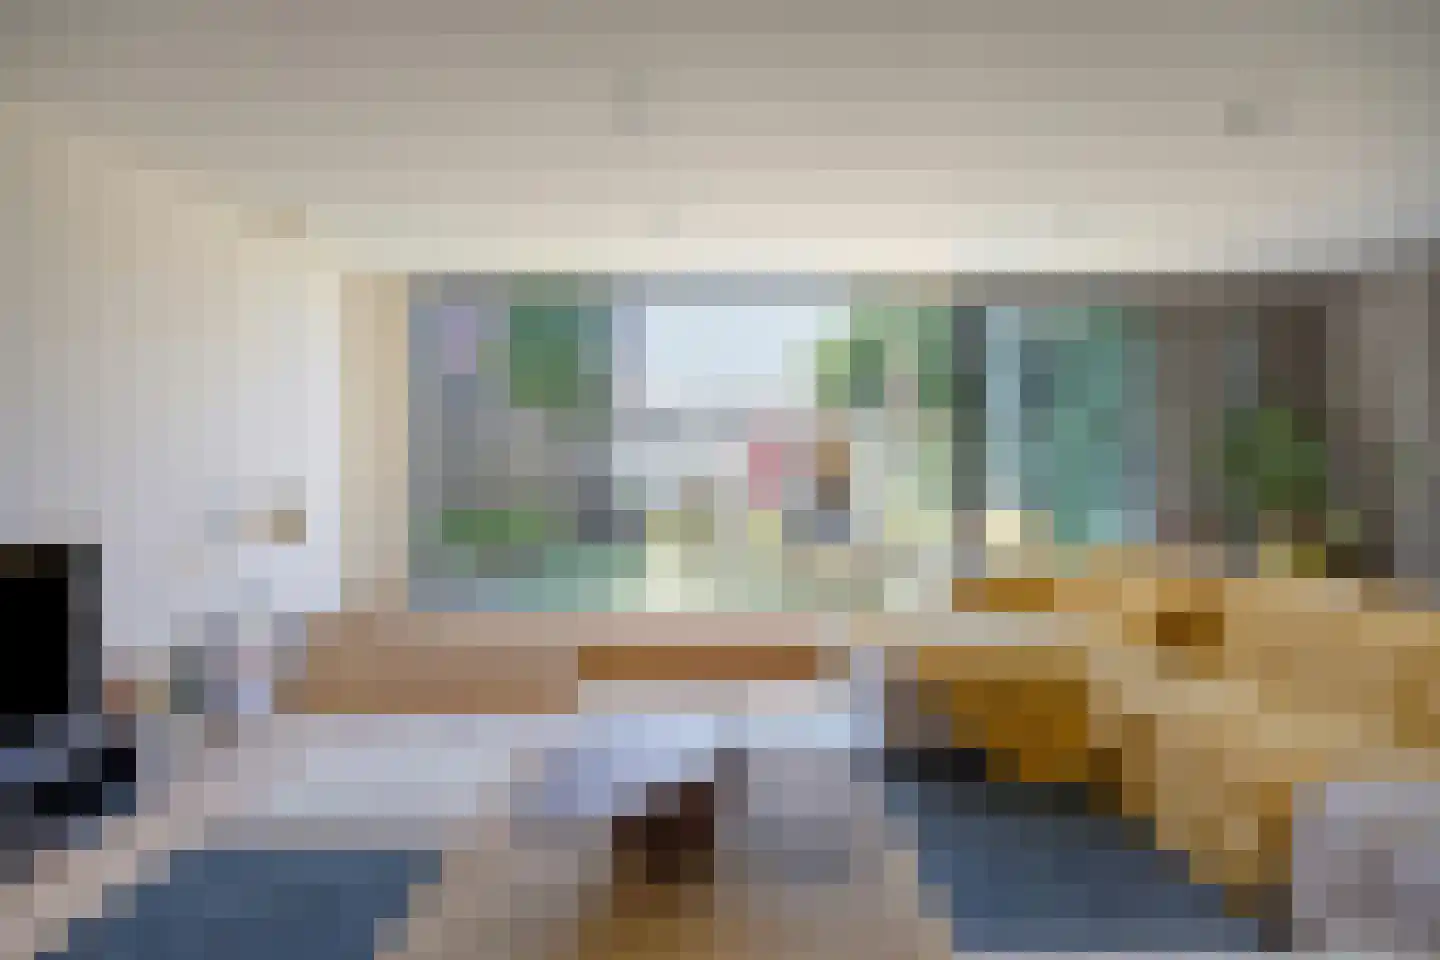
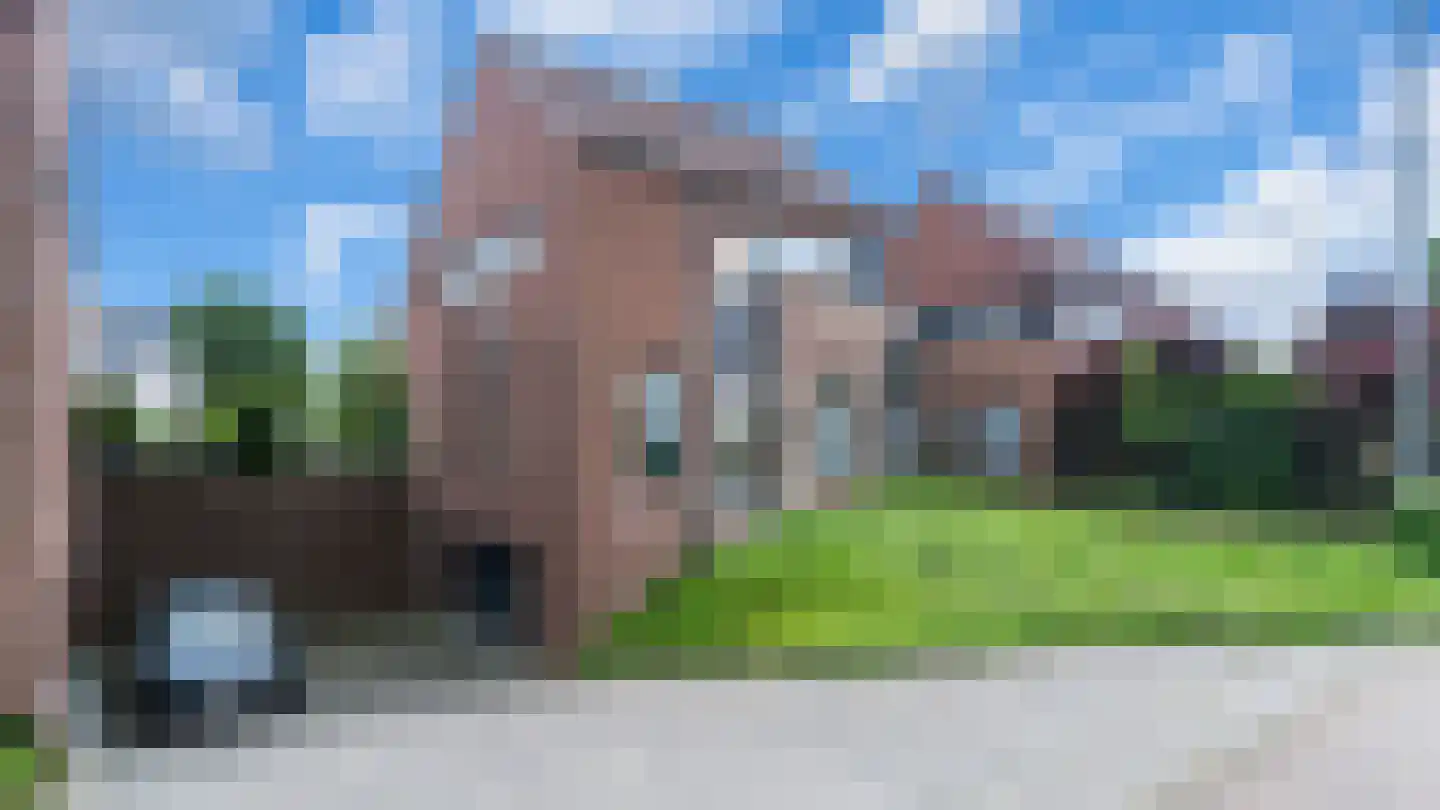
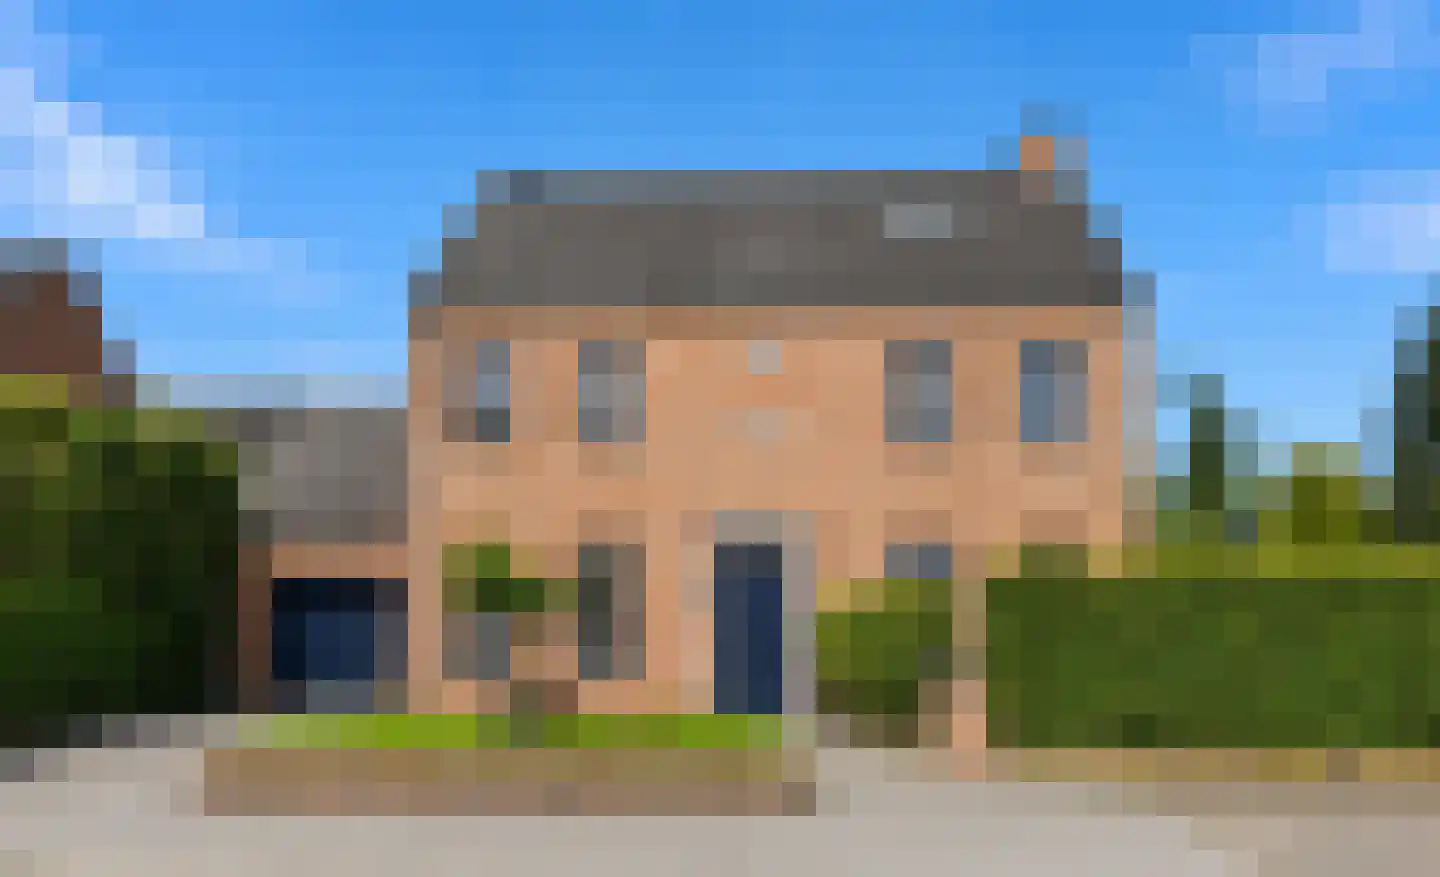
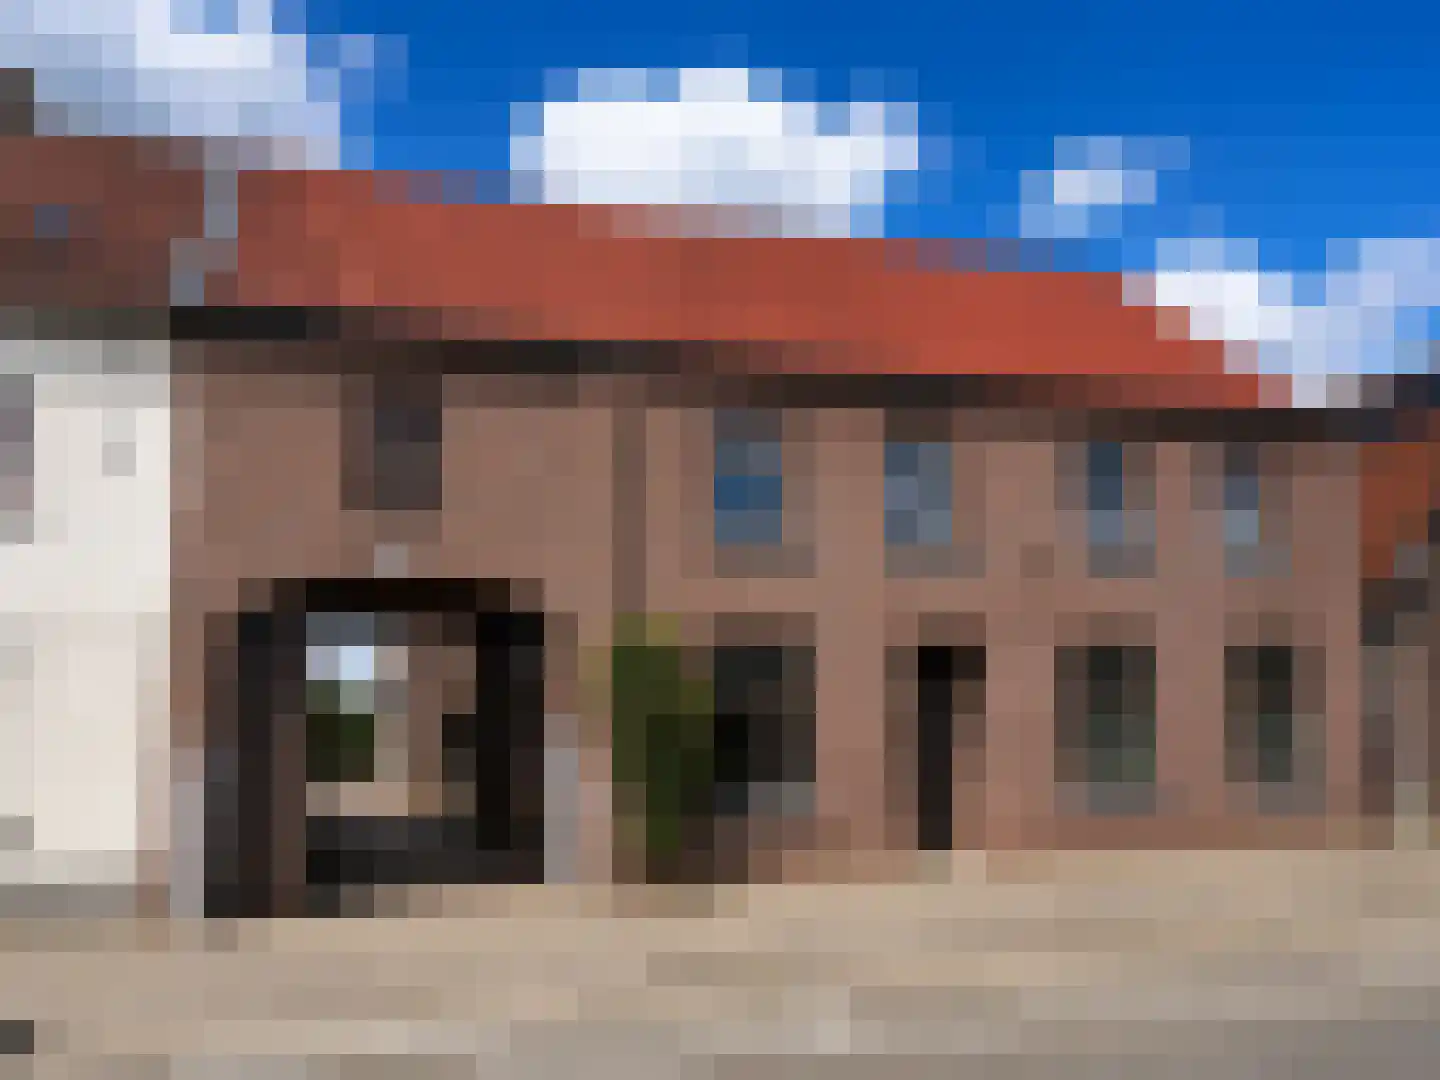
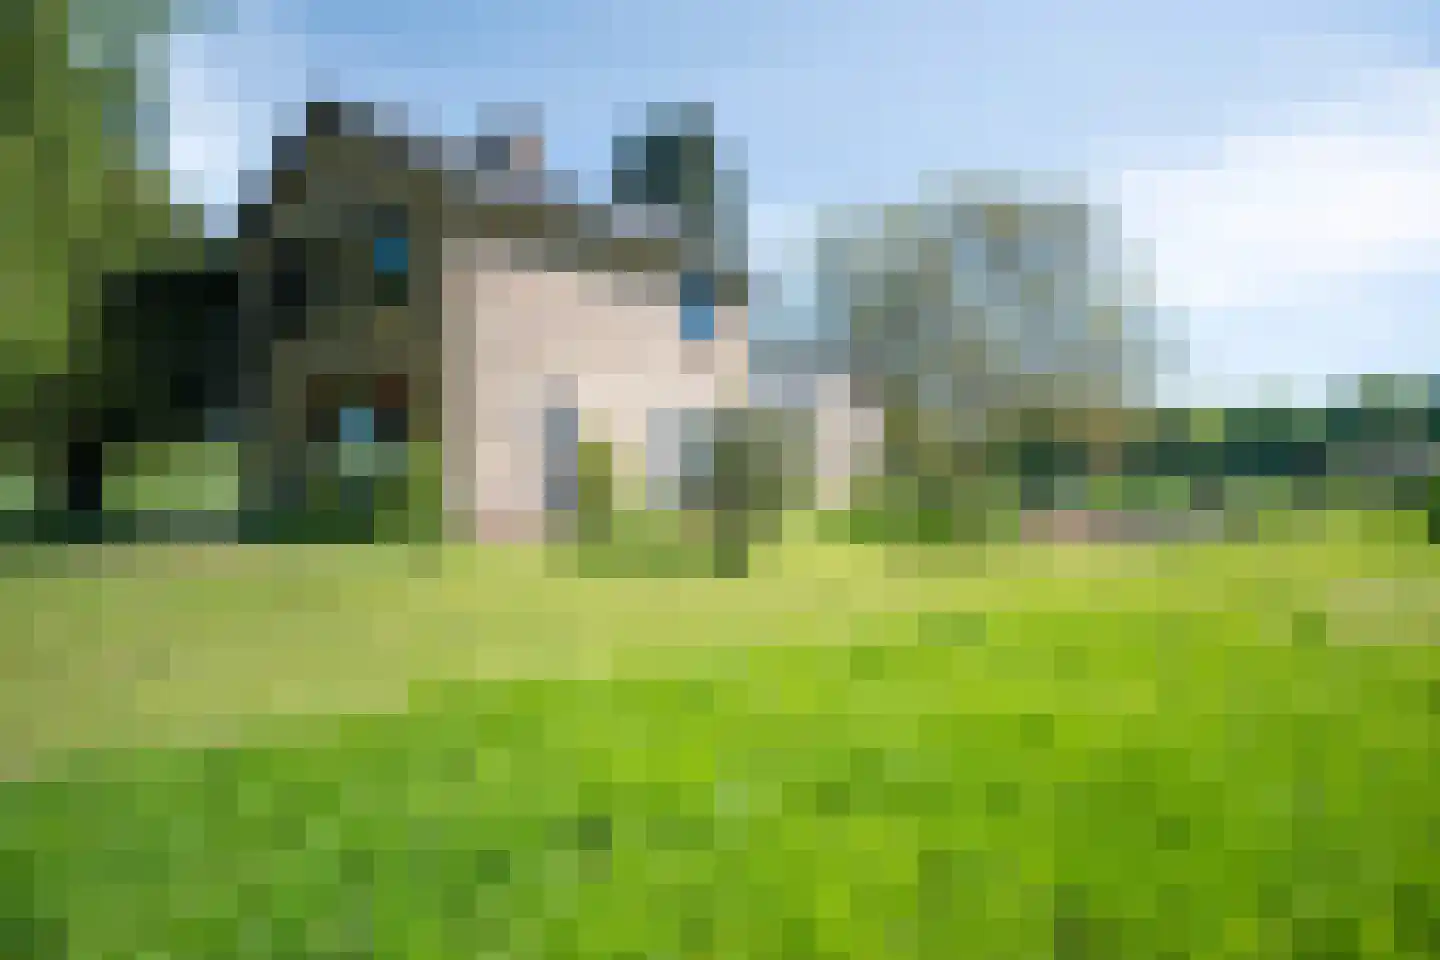
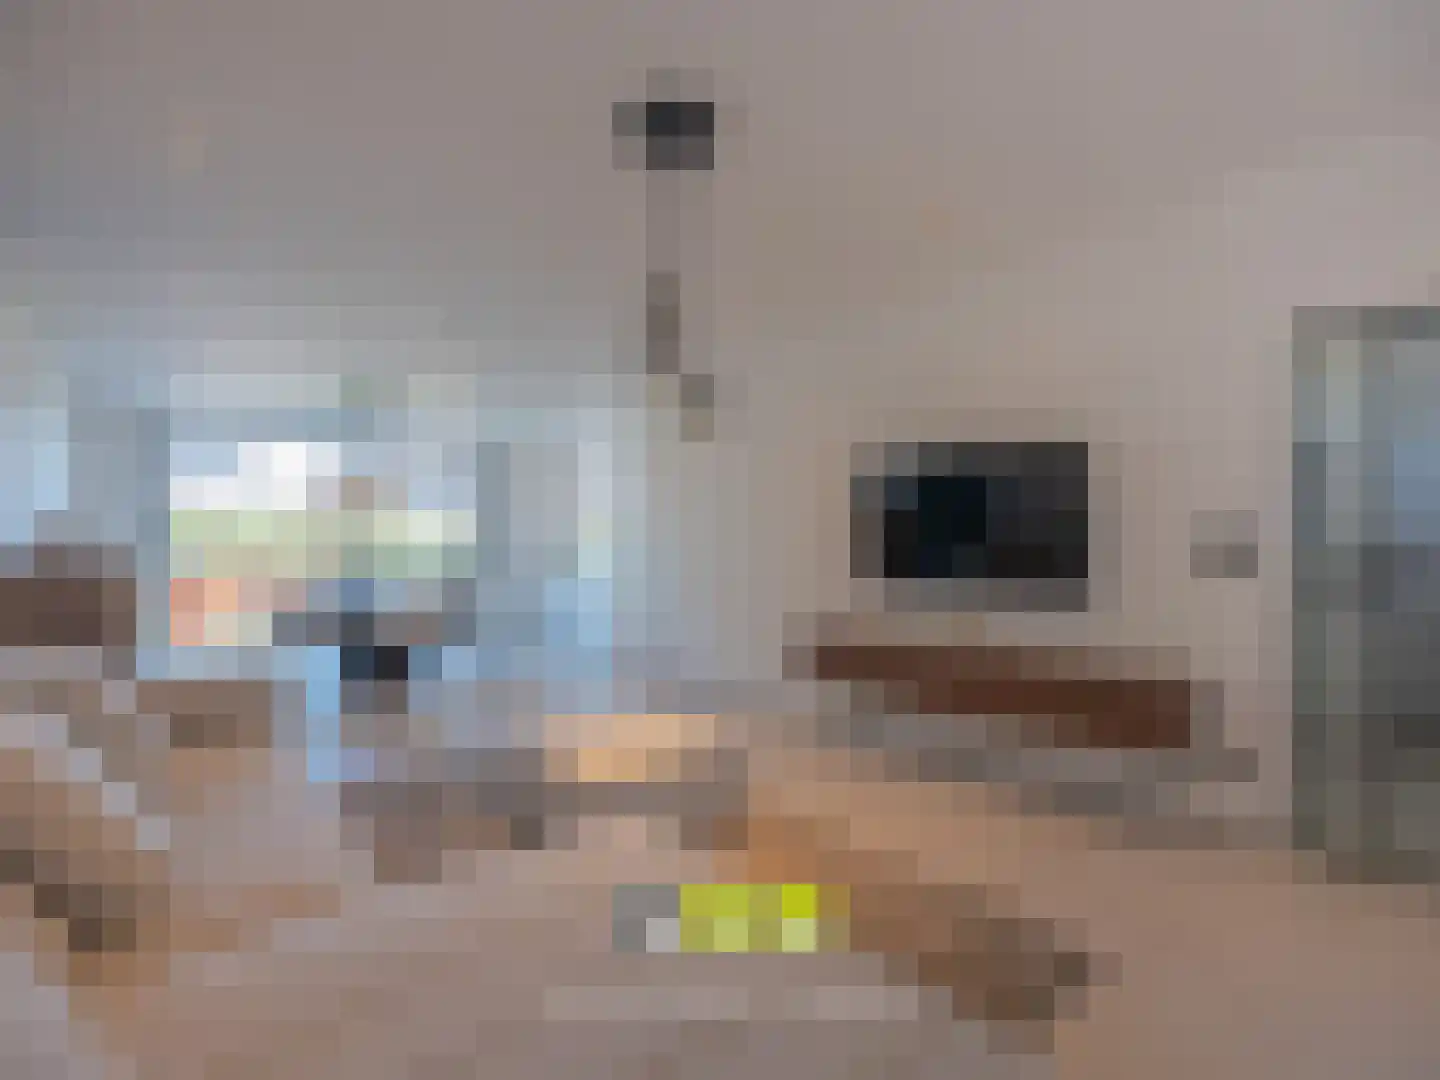
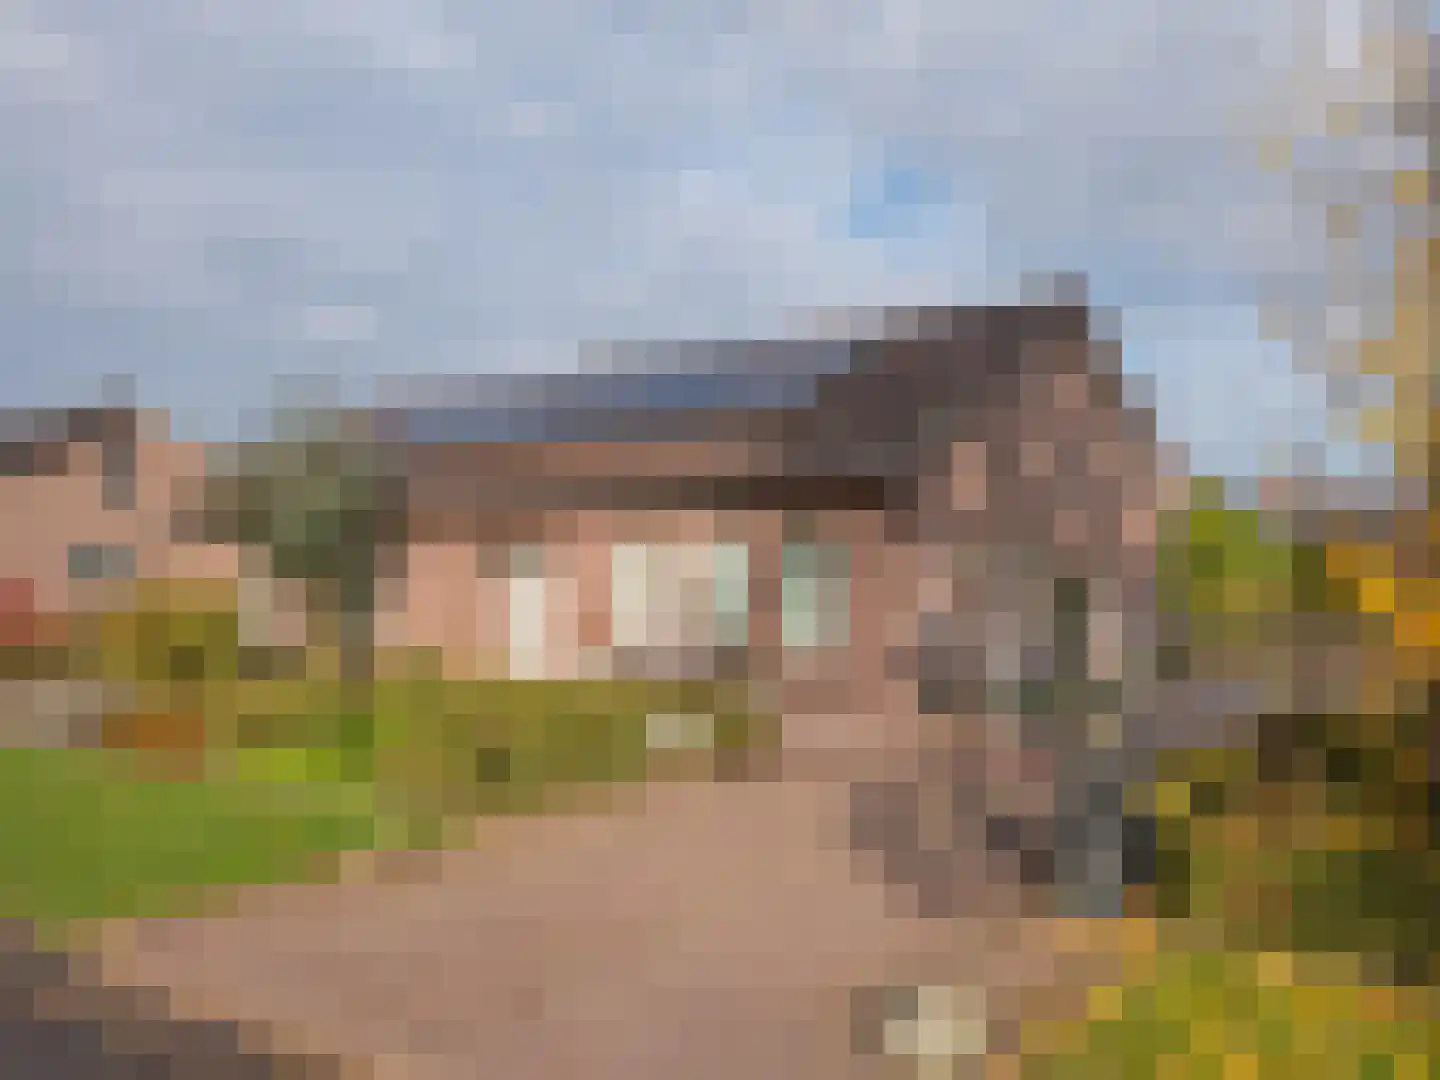
Unieke stadswoning met terras, atelier en garage te koop Volledig gerenoveerde stadswoning met terras, atelier (240 m²) en garage (160 m²) te koop in Maaseik. De ideale plek voor wie wonen en werken wil combineren. Kom dit pand snel ontdekken! Deze verborgen parel is gelegen aan de Rueelstraat 23 in Maaseik. De woning is recent volledig vernieuwd en biedt naast een moderne woonruimte een indrukwekkend atelier van maar liefst 240 m². Of je nu droomt van een werkplaats aan huis, een praktijkruimte of simpelweg veel plek voor je hobby, de combinatie van ruimte en de recente renovatie maakt deze woning tot een zeldzame vondst in de stad. Indeling: Verdieping 0: - Inpandige garage (160 m²) - Aparte inkomhal woonst Verdieping + 1 - gastentoilet - woonkamer - eetkamer - keuken met eiland - berging - ruim terras (circa 80,50 m²) Verdieping +2 - ruime nachthal - 3 slaapkamers - badkamer met ligbad Atelier - atelier met 2 verdiepingen en vide (240 m²)
€ 499.000
Cost of copper (estimated): € 11.830
2% transfer tax (€ 9.980) + notary (€ 1.150) + valuation (€ 700)
Total purchase (incl. p.p.): € 510.830
3,04%
Yearly
€ 24.950
Direct available
Estimated mortgage
Indicative gross monthly cost
Based on annuity and 30 year term
Indicative net monthly cost
iDisclaimer: this mortgage calculation is a simplified indication based on general assumptions. No rights can be derived from the results shown. Calculated with 10-annual interest (zonder NHG), automatically determined based on the price limit € 470.000. Source: 10-jaars rente uit mortgage_rates (04-06-2026 03:45). For non-NHG, an 80% mortgage of the market value has been used in this indication.
Dubbele wastafel, ligbad, en toilet
Elektrische deur, elektra en stromend water
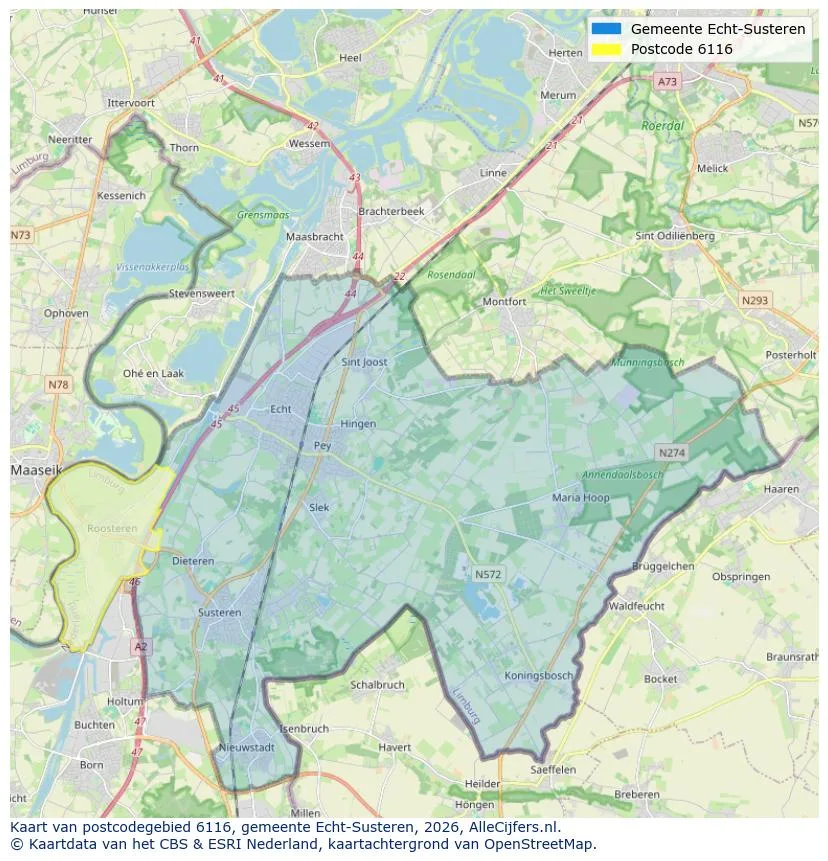
Geographic orientation and real estate agent density in Roosteren
View current location data on residents, WOZ development, housing stock, energy consumption, business activity and safety in Roosteren. In 2026 were there 1.516 residents. The average WOZ value in 2025 is EUR 332.000.
Residents
1.516
Last year: 2026
Average WOZ
EUR 332.000
Last year: 2025
Average income per person.
EUR 33.100
Source: AllNumbers
Crimes (current year)
76
Total registered
| Year | Residents |
|---|---|
| 2021 | 1.425 |
| 2022 | 1.450 |
| 2023 | 1.490 |
| 2024 | 1.495 |
| 2025 | 1.540 |
| 2026 | 1.516 |
| Year | Average WOZ |
|---|---|
| 2021 | EUR 254.000 |
| 2022 | EUR 265.000 |
| 2023 | EUR 307.000 |
| 2024 | EUR 304.000 |
| 2025 | EUR 332.000 |
Hoger
330
Praktisch
310
Middelbaar
500
Europa
200
Nederland
1.235
Buiten Europa
95
Label C
186
Label G
137
Label D
119
Label B
100
Label A
73
Label F
71
Label E
24
Label A++
6
Label A+
3
Label A+++
2
Label A++++
1
Label A+++++
0
| Year | Gas (m3) | Electricity (kWh) |
|---|---|---|
| 2020 | 1.640 | 3.430 |
| 2021 | 1.850 | 3.450 |
| 2022 | 1.440 | 3.300 |
| 2023 | 1.120 | 3.100 |
| 2024 | 1.100 | 3.260 |
Hoekwoning
Gas: 1.010 • Electricity: 2.760
Huurwoning
Gas: 920 • Electricity: 2.410
Koopwoning
Gas: 1.200 • Electricity: 3.360
Appartement
Gas: 720 • Electricity: 1.880
Tussenwoning
Gas: 960 • Electricity: 2.670
Vrijstaande woning
Gas: 1.370 • Electricity: 3.760
Twee-onder-één-kap woning
Gas: 1.050 • Electricity: 2.960
Total number of company establishments: 180
| Period | Crimes |
|---|---|
| jan 2026 | 8 |
| jul 2025 | 5 |
| jun 2025 | 7 |
| mei 2025 | 11 |
| mrt 2025 | 12 |
| mrt 2026 | 5 |
| nov 2024 | 7 |
| nov 2025 | 3 |
| okt 2024 | 11 |
| okt 2025 | 4 |
| sep 2024 | 8 |
| sep 2025 | 5 |
These figures give an indicative picture of safety trends in the living environment of Roosteren.
Short answers based on current local statistics, handy for a quick comparison of the living environment.
Roosteren telt in 2026 ongeveer 1.516 inwoners.
De gemiddelde WOZ-waarde in Roosteren is in 2025 circa € 332.000.
Het gemiddelde inkomen per inwoner in Roosteren ligt rond € 33.100 per jaar.
Voor het huidige jaar gaat het om ongeveer 76 geregistreerde misdrijven. Gebruik deze cijfers als indicatie en vergelijk trends per periode.
In Roosteren komt vooral "Vrijstaande woningen" veel voor, met ongeveer 249 woningen.
View more homes in this location.
6116AS Roosteren
€ 349.000 k.k.
€ 1.479/m²
6116AS Roosteren
€ 598.000 k.k.
€ 1.812/m²
6116BT Roosteren
€ 1.050.000 k.k.
€ 2.392/m²
6116AJ Roosteren
€ 525.000 k.k.
€ 4.487/m²
6116AS Roosteren
€ 549.000 k.k.
€ 2.874/m²

6116AH Roosteren
€ 1.200.000 k.k.
€ 3.692/m²
6116AS Roosteren
€ 499.000 k.k.
€ 2.559/m²

6116AS Roosteren
€ 860.000 k.k.
€ 3.440/m²
