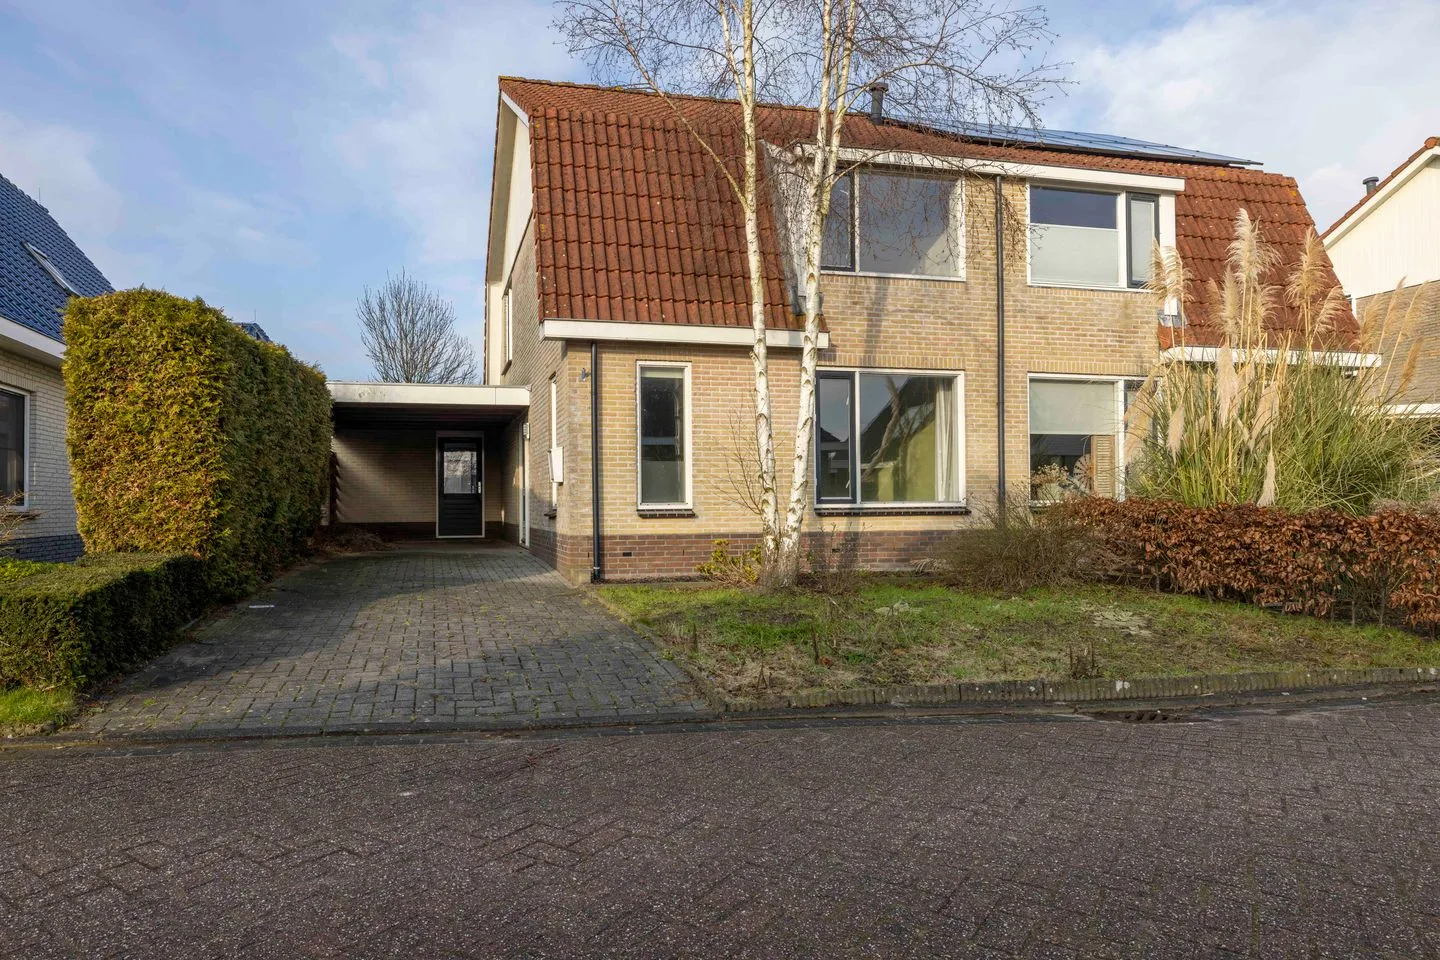
Houses sold in Rottevalle

View 5 sold houses in Rottevalle

Connected to: Vastgoed Nederland NVM Makelaars

On this page you will find recently sold homes in Rottevalle. Use this overview to better estimate selling prices, popular neighborhoods, and the local housing supply before you choose a real estate agent. Also view the current housing supply with 10 houses in Rottevalle.

Selection

Search and filter homes

Set your preferences and discover homes that suit you.

Total supply 242.483
Filters

Set price, area and other characteristics. Adjust a filter or click on Show homes. Location changes directly above.

Reset filters

You search for

  • Place Rottevalle
  • Status Sold

Huis verkopen in Rottevalle? Vergelijk verkoopmakelaars

Bekijk recente verkopen en ontvang gratis offertes van lokale makelaars. Vergelijk meer dan 35 makelaars in Rottevalle.

Free request a quote

  • Quotes in Rottevalle
  • Non-binding
  • Personal
  • Gratis tarieven vergelijken

Zelf je woning verkopen in Rottevalle? Vergelijk verkoopmakelaars in Rottevalle of bekijk de beste verkoopmakelaars in Rottevalle als referentie bij jouw keuze.

Vergelijk meerdere offertes

Makelaars maken scherpere voorstellen als ze weten dat je vergelijkt — vraag offertes aan voor verkoop of aankoop.

Frequently asked questions about sold homes in Rottevalle

Short answers about housing prices, sold homes and comparing real estate agents in Rottevalle.

Residential and neighborhood statistics in Rottevalle

View current location data on residents, WOZ development, housing stock, energy consumption, business activity and safety in Rottevalle. In 2025 were there 1.415 residents. The average WOZ value in 2025 is EUR 338.000.

These figures help to better assess and compare the housing stock in Rottevalle with recent sold homes. Orient yourself then on suitable top real estate agents in Rottevalle for sales advice in this region.

Residents

1.415

Last year: 2025

Average WOZ

EUR 338.000

Last year: 2025

Average income per person.

EUR 29.400

Source: AllNumbers

Crimes (current year)

31

Total registered

Demographics and WOZ development

Inhabitants per year

Inhabitants per year in Rottevalle
Year Residents
2021 1.405
2022 1.405
2023 1.410
2024 1.425
2025 1.415

Annual WOZ value

WOZ value per year in Rottevalle
Year Average WOZ
2021 EUR 248.000
2022 EUR 270.000
2023 EUR 314.000
2024 EUR 332.000
2025 EUR 338.000

Composition of residents

Age build-up

65+: 295 0-15: 255 15-25: 135 25-45: 320 45-65: 405

Education level

Hoger

280

Praktisch

260

Middelbaar

500

Origin of residents (2025)

Europa

25

Nederland

1.365

Buiten Europa

25

Housing stock and construction periods

Types of homes

Hoekwoningen 46
Appartementen 46
Tussenwoningen 40
Vrijstaande woningen 352
Twee-onder-één-kap woningen 139

Construction period of buildings

Voor 1700 0
1700 tot 1900 50
1900 tot 1925 32
1925 tot 1950 68
1950 tot 1970 146
1970 tot 1980 76
1980 tot 1990 58
1990 tot 2000 95
2000 tot 2010 62
2010 tot 2020 13
2020 en later 11

Energy and sustainability

Energy label distribution

Label A

147

Label C

126

Label G

104

Label B

94

Label F

54

Label D

39

Label E

26

Label A++

4

Label A+

1

Label A+++

1

Label A++++

0

Label A+++++

0

Average energy consumption per year

Average energy consumption per year in Rottevalle
Year Gas (m3) Electricity (kWh)
2020 1.450 2.920
2021 1.640 3.000
2022 1.260 2.870
2023 1.020 2.730
2024 1.000 2.820

Consumption per house type

Hoekwoning

Gas: 880 • Electricity: 2.090

Huurwoning

Gas: 810 • Electricity: 1.840

Koopwoning

Gas: 1.110 • Electricity: 3.110

Appartement

Gas: 650 • Electricity: 1.900

Tussenwoning

Gas: 810 • Electricity: 1.910

Vrijstaande woning

Gas: 1.150 • Electricity: 3.260

Twee-onder-één-kap woning

Gas: 920 • Electricity: 2.110

Business activity in Rottevalle (2025)

Handel en HORECA 25
Nijverheid en energie 35
Zakelijke dienstverlening 30
Overheid, onderwijs en zorg 30
Landbouw, bosbouw en visserij 10
Vervoer, informatie en communicatie 10
Financiele diensten en onroerendgoed 5
Cultuur, recreatie en overige diensten 15

Total number of company establishments: 160

Recent crime statistics

Recent crime statistics in Rottevalle
Period Crimes
jan 2025 4
jan 2026 2
jul 2025 5
jun 2025 2
mei 2025 0
mrt 2025 4
nov 2024 2
nov 2025 2
okt 2024 1
okt 2025 2
sep 2024 4
sep 2025 2

These figures give an indicative picture of safety trends in the living environment of Rottevalle.

Frequently asked questions about living in Rottevalle

Short answers based on current local statistics, handy for a quick comparison of the living environment.

Hoeveel inwoners heeft Rottevalle?

Rottevalle telt in 2025 ongeveer 1.415 inwoners.

Wat is de gemiddelde WOZ-waarde in Rottevalle?

De gemiddelde WOZ-waarde in Rottevalle is in 2025 circa € 338.000.

Wat is het gemiddelde inkomen per inwoner in Rottevalle?

Het gemiddelde inkomen per inwoner in Rottevalle ligt rond € 29.400 per jaar.

Hoe veilig is wonen in Rottevalle?

Voor het huidige jaar gaat het om ongeveer 31 geregistreerde misdrijven. Gebruik deze cijfers als indicatie en vergelijk trends per periode.

Welke woningtypen komen het meest voor in Rottevalle?

In Rottevalle komt vooral "Vrijstaande woningen" veel voor, met ongeveer 352 woningen.

Gratis vrijblijvende offertes ontvangen

Vergelijk meerdere makelaars en kies de beste match.