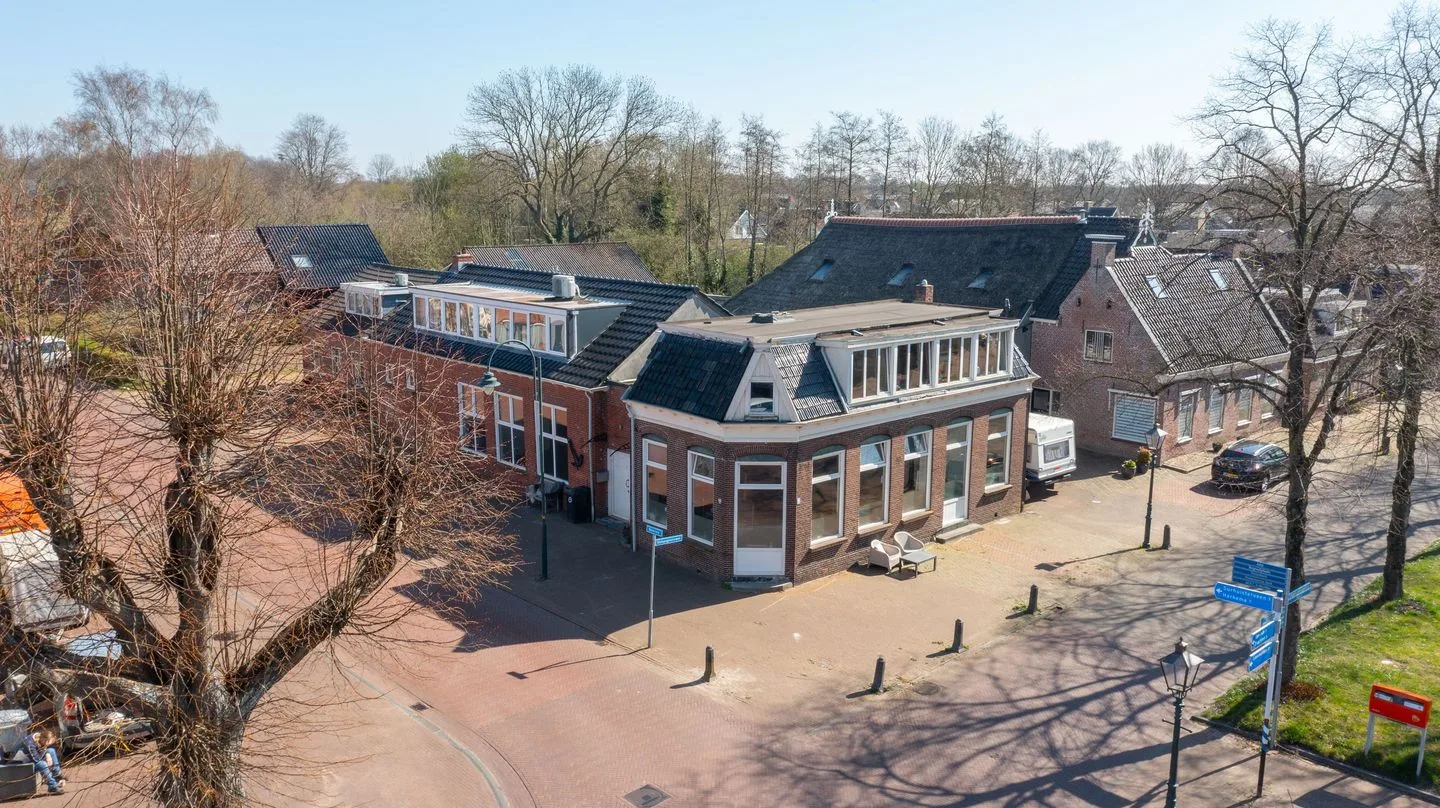
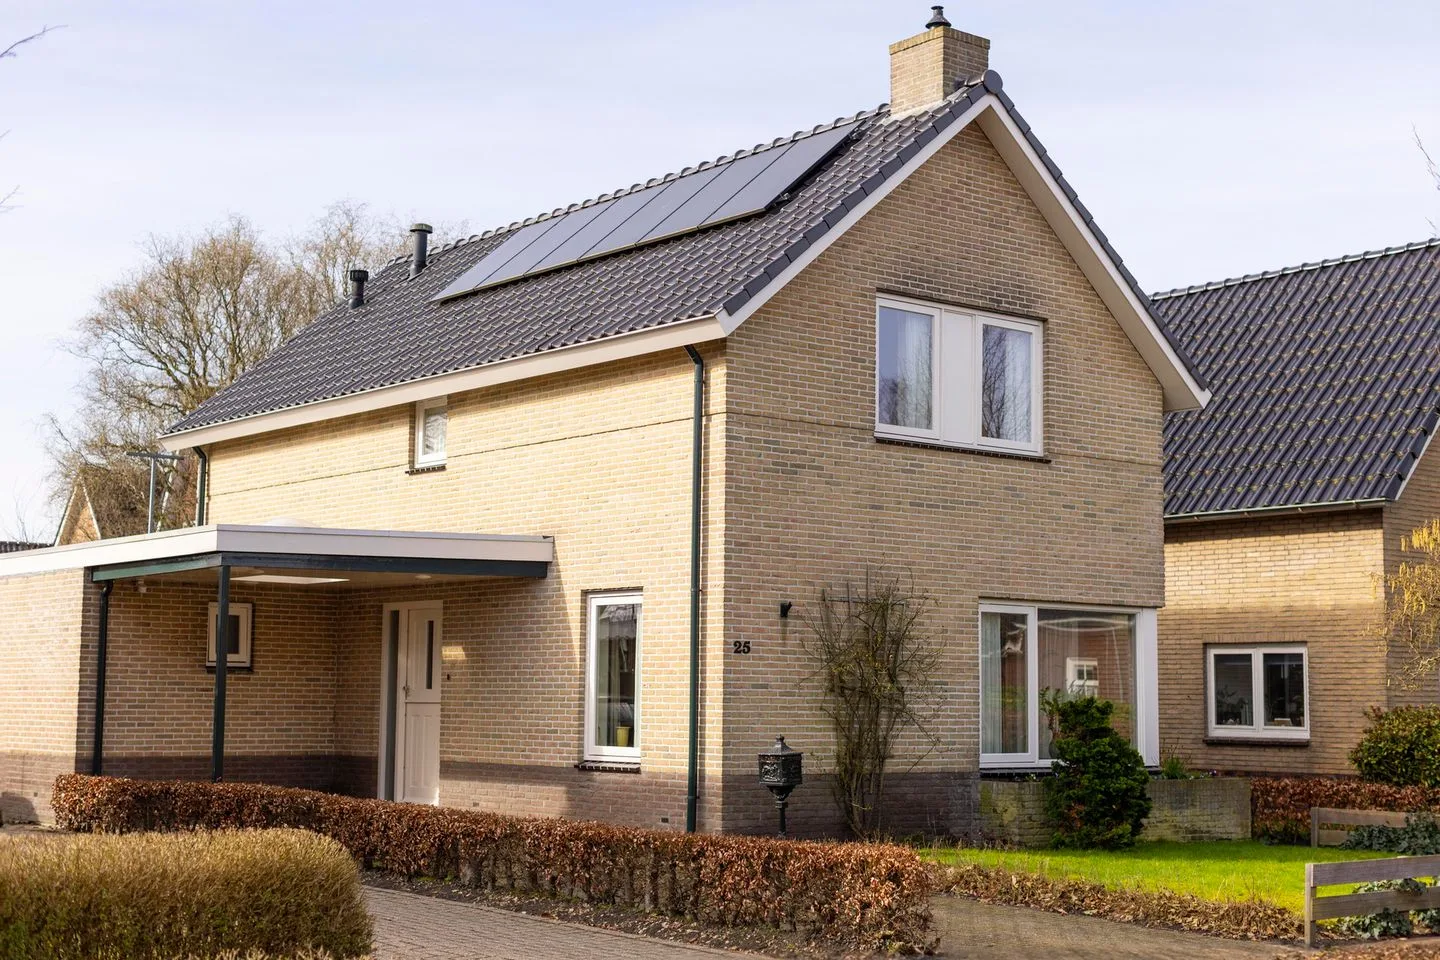
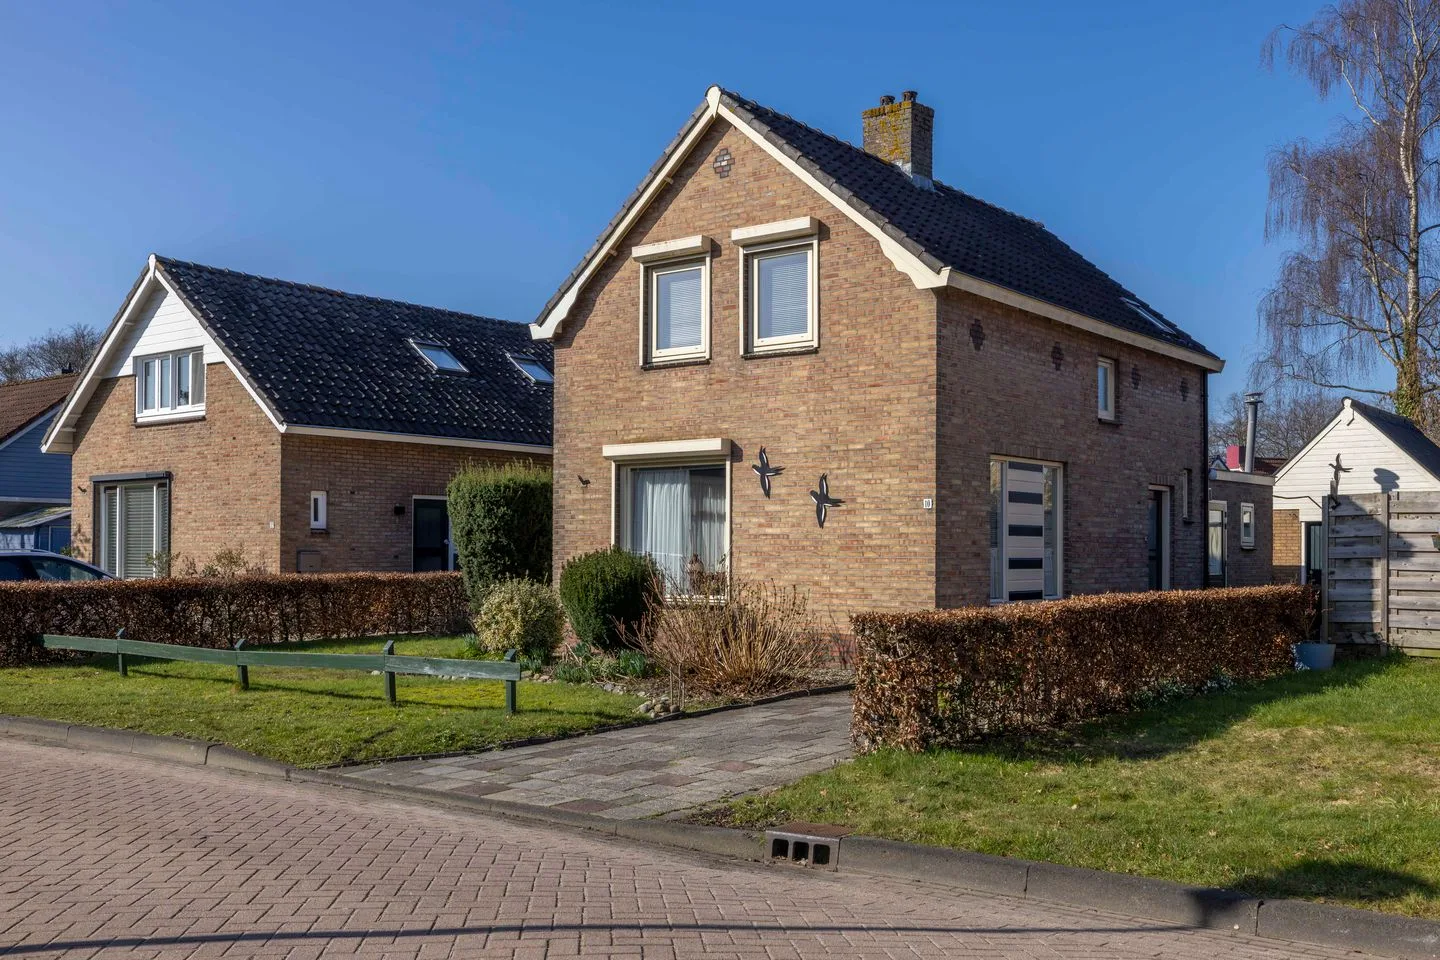
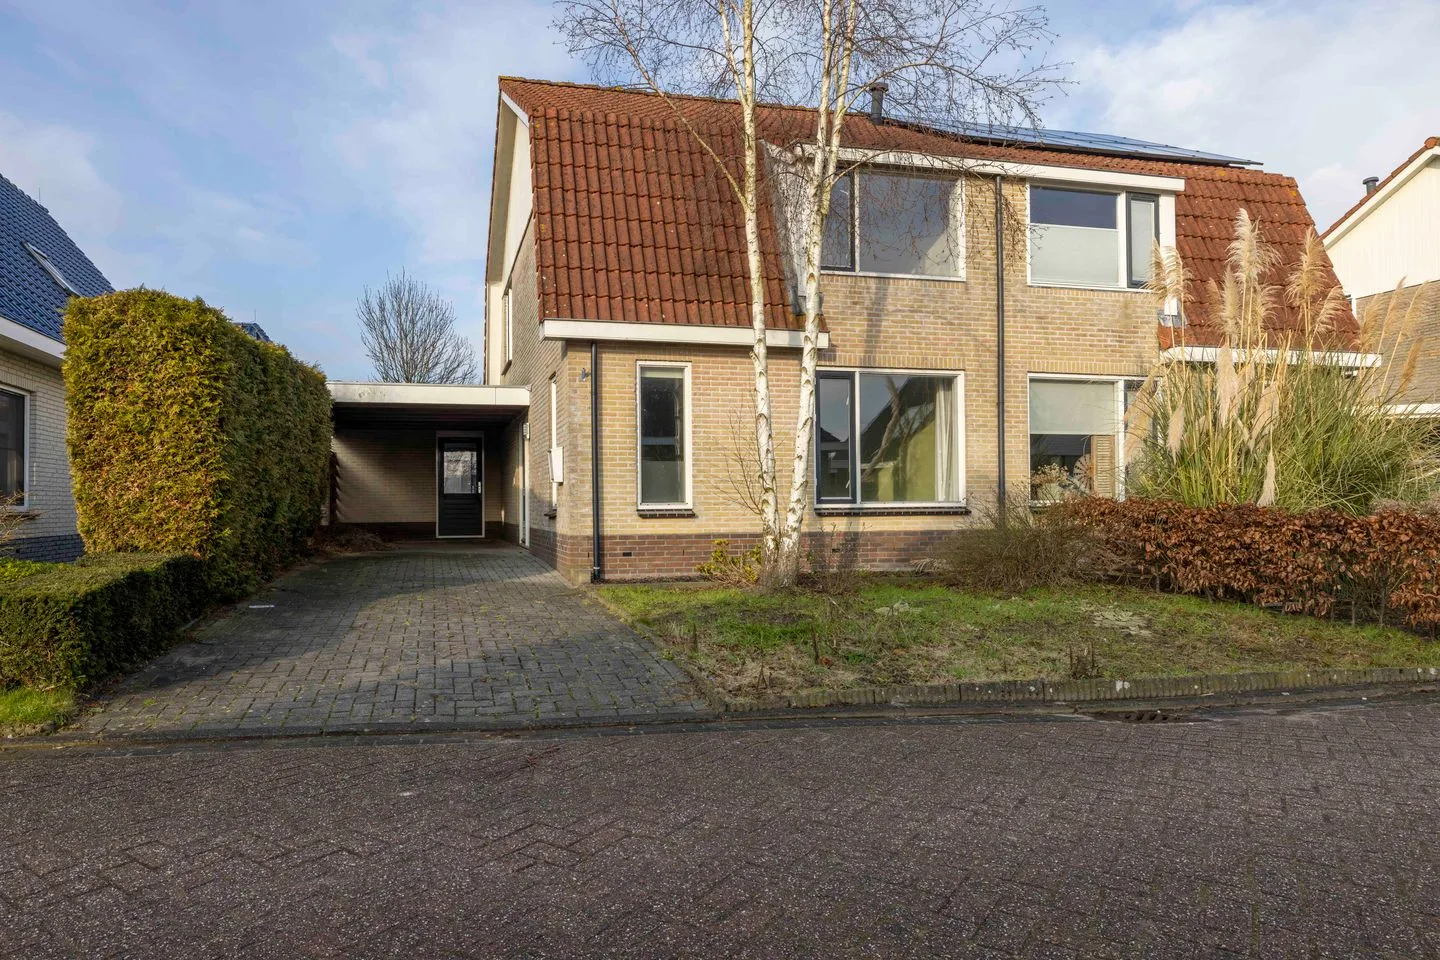
Housing offer in Rottevalle

Searching in 10 houses in Rottevalle

Connected to: Vastgoed Nederland NVM Makelaars

View the current housing stock in Rottevalle and quickly filter by price, living area, rooms and more. There are currently 10 houses in this place within our selection. View also 7 sold houses in Rottevalle for extra insight into the local housing market.

Selection

Search and filter homes

Set your preferences and discover homes that suit you.

Total supply 246.702
Filters

Set price, area and other characteristics. Adjust a filter or click on Show homes. Location changes directly above.

Reset filters

You search for

  • Place Rottevalle

Selling a home in Rottevalle? Compare realtor offers

Get free quotes from real estate agents with local market knowledge. Compare more than 35 real estate agents in Rottevalle.

Free request a quote

  • Quotes in Rottevalle
  • Non-binding
  • Personal
  • Compare free rates

Selling a home in Rottevalle? Compare all real estate agents in Rottevalle or view the top 10 real estate agents in Rottevalle for extra context for your choice.

Compare multiple quotes

Real estate agents make sharper offers when they know you're comparing — ask for quotes for sale or purchase.

Frequently asked questions about homes in Rottevalle

Practical answers about housing supply, sales and comparing real estate agents in Rottevalle.

Residential and neighborhood statistics in Rottevalle

View current location data on residents, WOZ development, housing stock, energy consumption, business activity and safety in Rottevalle. In 2026 were there 1.412 residents. The average WOZ value in 2025 is EUR 338.000.

These figures help to better assess and compare the housing stock in Rottevalle with recent sold homes. Orient yourself then on suitable top real estate agents in Rottevalle for sales advice in this region.

Residents

1.412

Last year: 2026

Average WOZ

EUR 338.000

Last year: 2025

Average income per person.

EUR 29.400

Source: AllNumbers

Crimes (current year)

31

Total registered

Demographics and WOZ development

Inhabitants per year

Inhabitants per year in Rottevalle
Year Residents
2021 1.405
2022 1.405
2023 1.410
2024 1.425
2025 1.415
2026 1.412

Annual WOZ value

WOZ value per year in Rottevalle
Year Average WOZ
2021 EUR 248.000
2022 EUR 270.000
2023 EUR 314.000
2024 EUR 332.000
2025 EUR 338.000

Composition of residents

Age build-up

65+: 320 0-15: 260 15-25: 135 25-45: 315 45-65: 380

Education level

Hoger

280

Praktisch

260

Middelbaar

500

Origin of residents (2025)

Europa

25

Nederland

1.365

Buiten Europa

25

Housing stock and construction periods

Types of homes

Hoekwoningen 46
Appartementen 46
Tussenwoningen 40
Vrijstaande woningen 352
Twee-onder-één-kap woningen 139

Construction period of buildings

Voor 1700 0
1700 tot 1900 50
1900 tot 1925 32
1925 tot 1950 68
1950 tot 1970 146
1970 tot 1980 76
1980 tot 1990 58
1990 tot 2000 95
2000 tot 2010 62
2010 tot 2020 13
2020 en later 11

Energy and sustainability

Energy label distribution

Label A

147

Label C

126

Label G

104

Label B

94

Label F

54

Label D

39

Label E

26

Label A++

4

Label A+

1

Label A+++

1

Label A++++

0

Label A+++++

0

Average energy consumption per year

Average energy consumption per year in Rottevalle
Year Gas (m3) Electricity (kWh)
2020 1.450 2.920
2021 1.640 3.000
2022 1.260 2.870
2023 1.020 2.730
2024 1.000 2.820

Consumption per house type

Hoekwoning

Gas: 880 • Electricity: 2.090

Huurwoning

Gas: 810 • Electricity: 1.840

Koopwoning

Gas: 1.110 • Electricity: 3.110

Appartement

Gas: 650 • Electricity: 1.900

Tussenwoning

Gas: 810 • Electricity: 1.910

Vrijstaande woning

Gas: 1.150 • Electricity: 3.260

Twee-onder-één-kap woning

Gas: 920 • Electricity: 2.110

Business activity in Rottevalle (2025)

Handel en HORECA 25
Nijverheid en energie 35
Zakelijke dienstverlening 30
Overheid, onderwijs en zorg 30
Landbouw, bosbouw en visserij 10
Vervoer, informatie en communicatie 10
Financiele diensten en onroerendgoed 5
Cultuur, recreatie en overige diensten 15

Total number of company establishments: 160

Recent crime statistics

Recent crime statistics in Rottevalle
Period Crimes
jan 2026 2
jul 2025 5
jun 2025 2
mei 2025 0
mrt 2025 4
mrt 2026 3
nov 2024 2
nov 2025 2
okt 2024 1
okt 2025 2
sep 2024 4
sep 2025 2

These figures give an indicative picture of safety trends in the living environment of Rottevalle.

Frequently asked questions about living in Rottevalle

Short answers based on current local statistics, handy for a quick comparison of the living environment.

Hoeveel inwoners heeft Rottevalle?

Rottevalle telt in 2026 ongeveer 1.412 inwoners.

Wat is de gemiddelde WOZ-waarde in Rottevalle?

De gemiddelde WOZ-waarde in Rottevalle is in 2025 circa € 338.000.

Wat is het gemiddelde inkomen per inwoner in Rottevalle?

Het gemiddelde inkomen per inwoner in Rottevalle ligt rond € 29.400 per jaar.

Hoe veilig is wonen in Rottevalle?

Voor het huidige jaar gaat het om ongeveer 31 geregistreerde misdrijven. Gebruik deze cijfers als indicatie en vergelijk trends per periode.

Welke woningtypen komen het meest voor in Rottevalle?

In Rottevalle komt vooral "Vrijstaande woningen" veel voor, met ongeveer 352 woningen.

Receive free, non-binding quotes

Compare multiple real estate agents and choose the best match.