
Residents
4.270
Last year: 2025
7954ET Rouveen • Overijssel
For this property, no detailed description is available yet.
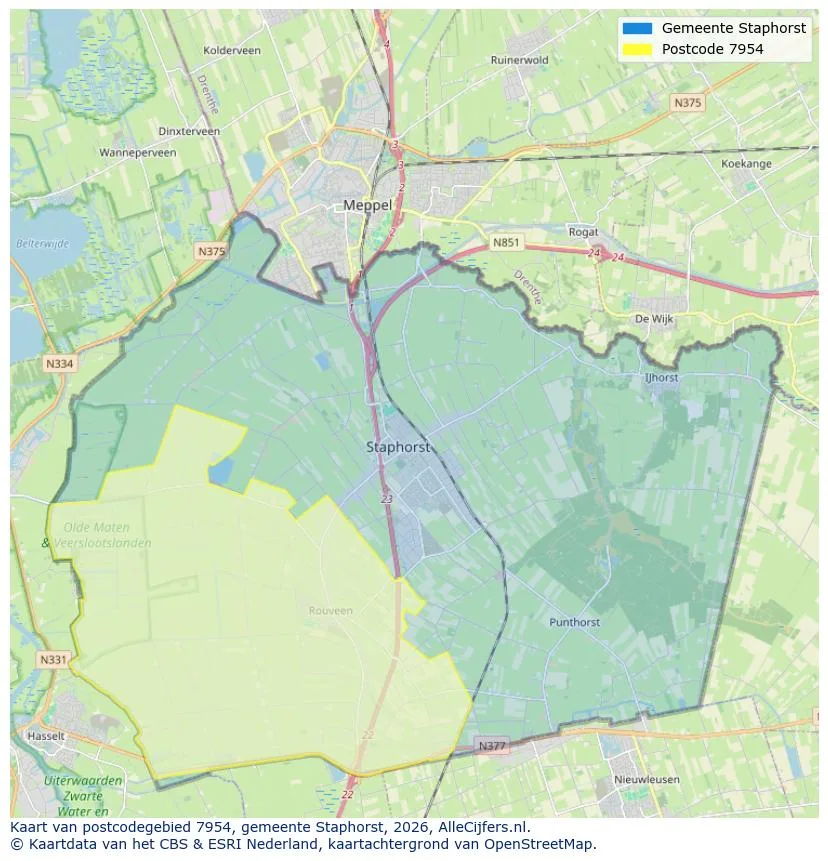
Geographic orientation and real estate agent density in Rouveen
View current location data on residents, WOZ development, housing stock, energy consumption, business activity and safety in Rouveen. In 2025 were there 4.270 residents. The average WOZ value in 2025 is EUR 385.356.
Residents
4.270
Last year: 2025
Average WOZ
EUR 385.356
Last year: 2025
Average income per person.
EUR 26.063
Source: AllNumbers
Crimes (current year)
69
Total registered
| Year | Residents |
|---|---|
| 2021 | 4.106 |
| 2022 | 4.129 |
| 2023 | 4.161 |
| 2024 | 4.148 |
| 2025 | 4.270 |
| Year | Average WOZ |
|---|---|
| 2021 | EUR 294.960 |
| 2022 | EUR 322.692 |
| 2023 | EUR 356.818 |
| 2024 | EUR 367.612 |
| 2025 | EUR 385.356 |
Hoger
540
Praktisch
819
Middelbaar
1.472
Europa
65
Nederland
4.070
Buiten Europa
135
Label A
330
Label G
249
Label B
164
Label C
150
Label F
103
Label D
62
Label A+++
40
Label E
33
Label A+
15
Label A++
7
Label A++++
5
Label A+++++
0
| Year | Gas (m3) | Electricity (kWh) |
|---|---|---|
| 2020 | 1.615 | 3.529 |
| 2021 | 1.828 | 3.645 |
| 2022 | 1.435 | 3.385 |
| 2023 | 1.194 | 3.273 |
| 2024 | 1.158 | 3.373 |
Hoekwoning
Gas: 816 • Electricity: 2.086
Huurwoning
Gas: 1.081 • Electricity: 2.520
Koopwoning
Gas: 1.223 • Electricity: 3.426
Appartement
Gas: 1.214 • Electricity: 3.165
Tussenwoning
Gas: 859 • Electricity: 2.525
Vrijstaande woning
Gas: 1.357 • Electricity: 3.665
Twee-onder-één-kap woning
Gas: 1.043 • Electricity: 3.020
Total number of company establishments: 510
| Period | Crimes |
|---|---|
| jan 2025 | 4 |
| jan 2026 | 4 |
| jul 2025 | 11 |
| jun 2025 | 2 |
| mei 2025 | 4 |
| mrt 2025 | 9 |
| nov 2024 | 10 |
| nov 2025 | 6 |
| okt 2024 | 6 |
| okt 2025 | 8 |
| sep 2024 | 8 |
| sep 2025 | 3 |
These figures give an indicative picture of safety trends in the living environment of Rouveen.
Short answers based on current local statistics, handy for a quick comparison of the living environment.
Rouveen telt in 2025 ongeveer 4.270 inwoners.
De gemiddelde WOZ-waarde in Rouveen is in 2025 circa € 385.356.
Het gemiddelde inkomen per inwoner in Rouveen ligt rond € 26.063 per jaar.
Voor het huidige jaar gaat het om ongeveer 69 geregistreerde misdrijven. Gebruik deze cijfers als indicatie en vergelijk trends per periode.
In Rouveen komt vooral "Vrijstaande woningen" veel voor, met ongeveer 574 woningen.
View more homes in this location.

7954EB Rouveen
€ 535.000 k.k.
€ 3.110/m²

7954GR Rouveen
€ 875.000 k.k.

7954ER Rouveen
€ 420.000 k.k.
€ 4.468/m²

7954HC Rouveen
€ 350.000 k.k.
€ 2.592/m²

7954ED Rouveen
€ 495.000 k.k.
€ 2.812/m²

7954EH Rouveen
€ 425.000 k.k.
€ 3.244/m²

7954EJ Rouveen
€ 357.500 k.k.
€ 2.792/m²

7954EV Rouveen
€ 299.000 k.k.
€ 2.990/m²
