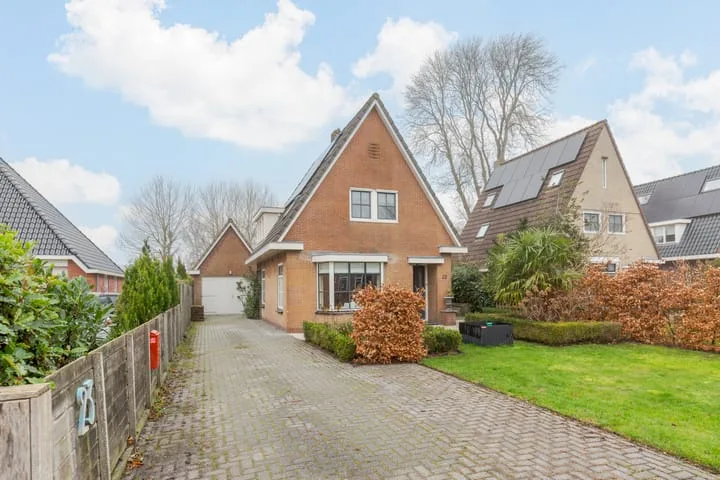
Houses sold in Scharnegoutum

View 5 sold houses in Scharnegoutum

Connected to: Vastgoed Nederland NVM Makelaars

On this page you will find recently sold homes in Scharnegoutum. Use this overview to better estimate selling prices, popular neighborhoods, and the local housing supply before you choose a real estate agent. Also view the current housing supply with 10 houses in Scharnegoutum.

Selection

Search and filter homes

Set your preferences and discover homes that suit you.

Total supply 241.753
Filters

Set price, area and other characteristics. Adjust a filter or click on Show homes. Location changes directly above.

Reset filters

You search for

  • Place Scharnegoutum
  • Status Sold

Sell your house in Scharnegoutum? Compare real estate agents

View recent sales and receive free quotes from local real estate agents. Compare more than 23 real estate agents in Scharnegoutum.

Free request a quote

  • Quotes in Scharnegoutum
  • Non-binding
  • Personal
  • Compare free rates

Selling your own home in Scharnegoutum? Compare real estate agents in Scharnegoutum or view the best real estate agents in Scharnegoutum as a reference for your choice.

Compare multiple quotes

Real estate agents make sharper offers when they know you're comparing — ask for quotes for sale or purchase.

Frequently asked questions about sold homes in Scharnegoutum

Short answers about housing prices, sold homes and comparing real estate agents in Scharnegoutum.

Residential and neighborhood statistics in Scharnegoutum

View current location data on residents, WOZ development, housing stock, energy consumption, business activity and safety in Scharnegoutum. In 2025 were there 1.560 residents. The average WOZ value in 2025 is EUR 350.123.

These figures help to better assess and compare the housing stock in Scharnegoutum with recent sold homes. Orient yourself then on suitable top real estate agents in Scharnegoutum for sales advice in this region.

Residents

1.560

Last year: 2025

Average WOZ

EUR 350.123

Last year: 2025

Average income per person.

EUR 30.224

Source: AllNumbers

Crimes (current year)

29

Total registered

Demographics and WOZ development

Inhabitants per year

Inhabitants per year in Scharnegoutum
Year Residents
2021 1.630
2022 1.615
2023 1.585
2024 1.570
2025 1.560

Annual WOZ value

WOZ value per year in Scharnegoutum
Year Average WOZ
2021 EUR 257.507
2022 EUR 282.700
2023 EUR 317.529
2024 EUR 328.845
2025 EUR 350.123

Composition of residents

Age build-up

65+: 365 0-15: 245 15-25: 170 25-45: 310 45-65: 470

Education level

Hoger

340

Praktisch

240

Middelbaar

460

Origin of residents (2025)

Europa

45

Nederland

1.430

Buiten Europa

80

Housing stock and construction periods

Types of homes

Hoekwoningen 92
Appartementen 23
Tussenwoningen 126
Vrijstaande woningen 273
Twee-onder-één-kap woningen 179

Construction period of buildings

Voor 1700 0
1700 tot 1900 52
1900 tot 1925 59
1925 tot 1950 75
1950 tot 1970 76
1970 tot 1980 177
1980 tot 1990 56
1990 tot 2000 119
2000 tot 2010 76
2010 tot 2020 3
2020 en later 5

Energy and sustainability

Energy label distribution

Label C

168

Label B

157

Label A

128

Label G

90

Label D

87

Label F

37

Label E

22

Label A++

2

Label A+

1

Label A+++

1

Label A++++

1

Label A+++++

0

Average energy consumption per year

Average energy consumption per year in Scharnegoutum
Year Gas (m3) Electricity (kWh)
2020 1.409 2.912
2021 1.616 2.894
2022 1.237 2.665
2023 1.019 2.591
2024 997 2.674

Consumption per house type

Hoekwoning

Gas: 860 • Electricity: 1.857

Huurwoning

Gas: 960 • Electricity: 1.845

Koopwoning

Gas: 1.036 • Electricity: 2.809

Appartement

Gas: 906 • Electricity: 2.278

Tussenwoning

Gas: 814 • Electricity: 1.793

Vrijstaande woning

Gas: 1.096 • Electricity: 3.145

Twee-onder-één-kap woning

Gas: 925 • Electricity: 2.329

Business activity in Scharnegoutum (2025)

Handel en HORECA 35
Nijverheid en energie 25
Zakelijke dienstverlening 50
Overheid, onderwijs en zorg 25
Landbouw, bosbouw en visserij 10
Vervoer, informatie en communicatie 5
Financiele diensten en onroerendgoed 10
Cultuur, recreatie en overige diensten 20

Total number of company establishments: 185

Recent crime statistics

Recent crime statistics in Scharnegoutum
Period Crimes
jan 2025 3
jan 2026 2
jul 2025 0
jun 2025 4
mei 2025 3
mrt 2025 5
nov 2024 2
nov 2025 0
okt 2024 1
okt 2025 3
sep 2024 2
sep 2025 8

These figures give an indicative picture of safety trends in the living environment of Scharnegoutum.

Frequently asked questions about living in Scharnegoutum

Short answers based on current local statistics, handy for a quick comparison of the living environment.

Hoeveel inwoners heeft Scharnegoutum?

Scharnegoutum telt in 2025 ongeveer 1.560 inwoners.

Wat is de gemiddelde WOZ-waarde in Scharnegoutum?

De gemiddelde WOZ-waarde in Scharnegoutum is in 2025 circa € 350.123.

Wat is het gemiddelde inkomen per inwoner in Scharnegoutum?

Het gemiddelde inkomen per inwoner in Scharnegoutum ligt rond € 30.224 per jaar.

Hoe veilig is wonen in Scharnegoutum?

Voor het huidige jaar gaat het om ongeveer 29 geregistreerde misdrijven. Gebruik deze cijfers als indicatie en vergelijk trends per periode.

Welke woningtypen komen het meest voor in Scharnegoutum?

In Scharnegoutum komt vooral "Vrijstaande woningen" veel voor, met ongeveer 273 woningen.

Receive free, non-binding quotes

Compare multiple real estate agents and choose the best match.