
Residents
1.320
Last year: 2025
4209AB Schelluinen • Zuid-Holland
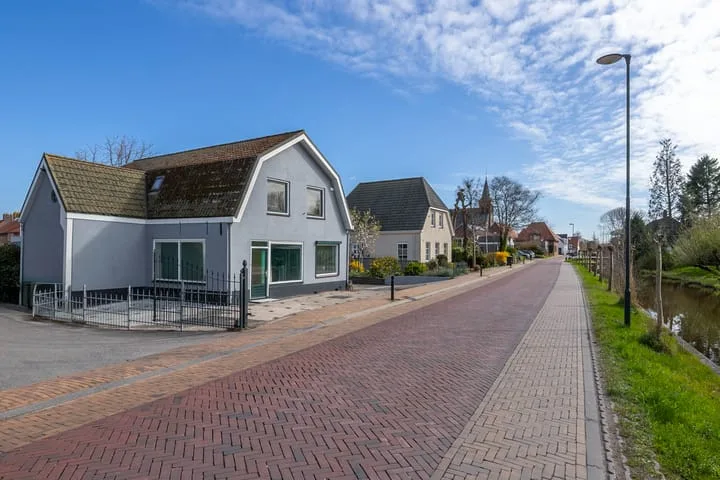
For this property, no detailed description is available yet.
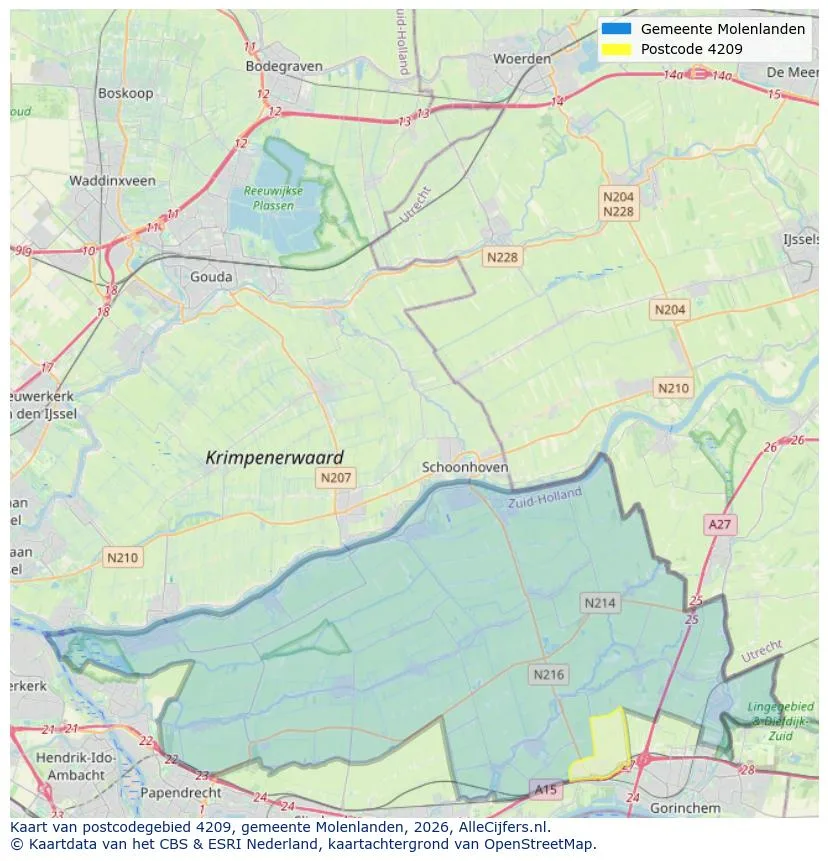
Geographic orientation and real estate agent density in Schelluinen
View current location data on residents, WOZ development, housing stock, energy consumption, business activity and safety in Schelluinen. In 2025 were there 1.320 residents. The average WOZ value in 2025 is EUR 452.000.
Residents
1.320
Last year: 2025
Average WOZ
EUR 452.000
Last year: 2025
Average income per person.
EUR 34.100
Source: AllNumbers
Crimes (current year)
48
Total registered
| Year | Residents |
|---|---|
| 2021 | 1.305 |
| 2022 | 1.340 |
| 2023 | 1.360 |
| 2024 | 1.355 |
| 2025 | 1.320 |
| Year | Average WOZ |
|---|---|
| 2021 | EUR 334.000 |
| 2022 | EUR 371.000 |
| 2023 | EUR 413.000 |
| 2024 | EUR 444.000 |
| 2025 | EUR 452.000 |
Hoger
230
Praktisch
270
Middelbaar
460
Europa
60
Nederland
1.155
Buiten Europa
105
Label C
173
Label A
162
Label B
93
Label D
64
Label G
43
Label E
29
Label F
19
Label A+
11
Label A+++
4
Label A++
3
Label A+++++
1
Label A++++
0
| Year | Gas (m3) | Electricity (kWh) |
|---|---|---|
| 2020 | 1.360 | 3.270 |
| 2021 | 1.530 | 3.380 |
| 2022 | 1.200 | 3.180 |
| 2023 | 1.000 | 3.090 |
| 2024 | 950 | 3.130 |
Hoekwoning
Gas: 870 • Electricity: 2.560
Huurwoning
Gas: 950 • Electricity: 2.610
Koopwoning
Gas: 1.010 • Electricity: 3.210
Appartement
Gas: 880 • Electricity: 2.990
Tussenwoning
Gas: 800 • Electricity: 2.290
Vrijstaande woning
Gas: 1.370 • Electricity: 4.030
Twee-onder-één-kap woning
Gas: 940 • Electricity: 3.670
Total number of company establishments: 255
| Period | Crimes |
|---|---|
| jan 2026 | 1 |
| jul 2025 | 6 |
| jun 2025 | 2 |
| mei 2025 | 6 |
| mrt 2025 | 7 |
| mrt 2026 | 5 |
| nov 2024 | 4 |
| nov 2025 | 6 |
| okt 2024 | 6 |
| okt 2025 | 3 |
| sep 2024 | 4 |
| sep 2025 | 7 |
These figures give an indicative picture of safety trends in the living environment of Schelluinen.
Short answers based on current local statistics, handy for a quick comparison of the living environment.
Schelluinen telt in 2025 ongeveer 1.320 inwoners.
De gemiddelde WOZ-waarde in Schelluinen is in 2025 circa € 452.000.
Het gemiddelde inkomen per inwoner in Schelluinen ligt rond € 34.100 per jaar.
Voor het huidige jaar gaat het om ongeveer 48 geregistreerde misdrijven. Gebruik deze cijfers als indicatie en vergelijk trends per periode.
In Schelluinen komt vooral "Vrijstaande woningen" veel voor, met ongeveer 159 woningen.
View more homes in this location.

4209AV Schelluinen
€ 389.000 k.k.
€ 3.740/m²
4209AR Schelluinen
€ 365.000 k.k.
€ 3.614/m²

4209SE Schelluinen
€ 925.000 k.k.
€ 4.579/m²

4209AM Schelluinen
€ 385.000 k.k.
€ 3.667/m²
4209SB Schelluinen
€ 585.000 k.k.
€ 2.554/m²

4209AJ Schelluinen
€ 320.000 k.k.
€ 4.384/m²

4209AN Schelluinen
€ 400.000 k.k.
€ 3.773/m²

4209AE Schelluinen
€ 350.000 k.k.
€ 3.763/m²
