
Residents
1.419
Last year: 2026
6265AM Sint Geertruid • Limburg
For this property, no detailed description is available yet.
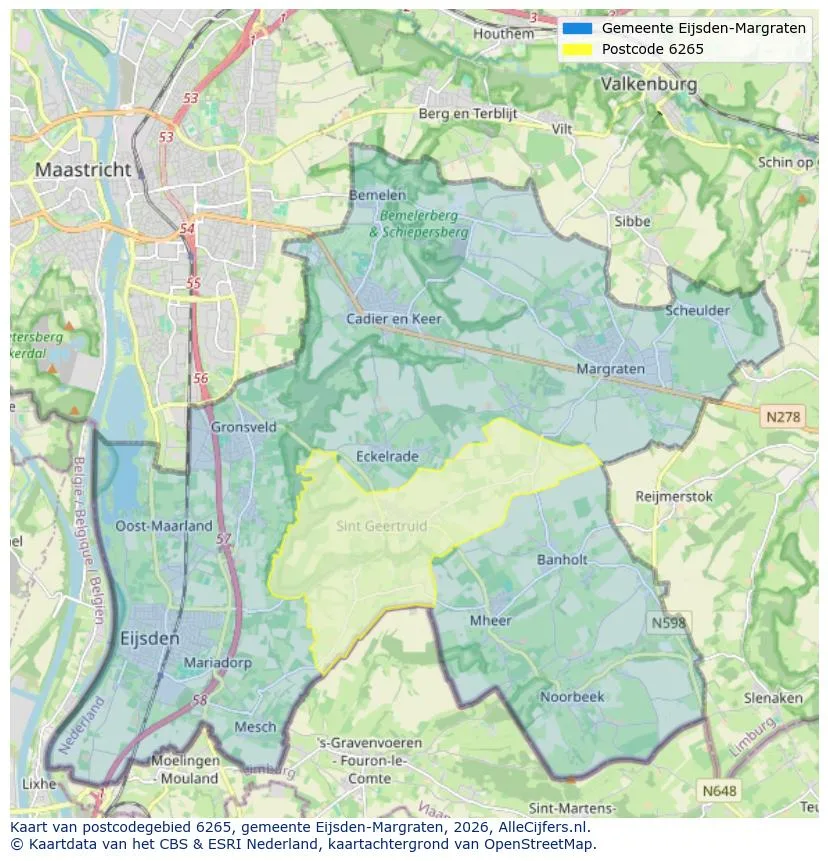
Explore Sint Geertruid and the surrounding areas
View current location data on residents, WOZ development, housing stock, energy consumption, business activity and safety in Sint Geertruid. In 2026 were there 1.419 residents. The average WOZ value in 2025 is EUR 418.976.
Residents
1.419
Last year: 2026
Average WOZ
EUR 418.976
Last year: 2025
Average income per person.
EUR 32.198
Source: AllNumbers
Crimes (current year)
33
Total registered
| Year | Residents |
|---|---|
| 2021 | 1.433 |
| 2022 | 1.413 |
| 2023 | 1.433 |
| 2024 | 1.418 |
| 2025 | 1.426 |
| 2026 | 1.419 |
| Year | Average WOZ |
|---|---|
| 2021 | EUR 311.832 |
| 2022 | EUR 325.834 |
| 2023 | EUR 383.400 |
| 2024 | EUR 391.244 |
| 2025 | EUR 418.976 |
Hoger
335
Praktisch
150
Middelbaar
307
Europa
114
Nederland
1.247
Buiten Europa
80
Label C
141
Label D
114
Label G
112
Label A
92
Label B
76
Label F
58
Label E
29
Label A+++
15
Label A+
5
Label A++
1
Label A++++
0
Label A+++++
0
| Year | Gas (m3) | Electricity (kWh) |
|---|---|---|
| 2020 | 1.642 | 3.388 |
| 2021 | 1.848 | 3.523 |
| 2022 | 1.455 | 3.317 |
| 2023 | 1.186 | 3.326 |
| 2024 | 1.132 | 3.452 |
Hoekwoning
Gas: 996 • Electricity: 2.486
Huurwoning
Gas: 917 • Electricity: 2.290
Koopwoning
Gas: 1.209 • Electricity: 3.491
Appartement
Gas: 914 • Electricity: 2.071
Tussenwoning
Gas: 783 • Electricity: 2.324
Vrijstaande woning
Gas: 1.331 • Electricity: 3.951
Twee-onder-één-kap woning
Gas: 1.094 • Electricity: 3.037
Total number of company establishments: 203
| Period | Crimes |
|---|---|
| jan 2026 | 1 |
| jul 2025 | 4 |
| jun 2025 | 3 |
| mei 2025 | 5 |
| mrt 2025 | 0 |
| mrt 2026 | 5 |
| nov 2024 | 0 |
| nov 2025 | 3 |
| okt 2024 | 4 |
| okt 2025 | 2 |
| sep 2024 | 1 |
| sep 2025 | 0 |
These figures give an indicative picture of safety trends in the living environment of Sint Geertruid.
Short answers based on current local statistics, handy for a quick comparison of the living environment.
Sint Geertruid telt in 2026 ongeveer 1.419 inwoners.
De gemiddelde WOZ-waarde in Sint Geertruid is in 2025 circa € 418.976.
Het gemiddelde inkomen per inwoner in Sint Geertruid ligt rond € 32.198 per jaar.
Voor het huidige jaar gaat het om ongeveer 33 geregistreerde misdrijven. Gebruik deze cijfers als indicatie en vergelijk trends per periode.
In Sint Geertruid komt vooral "Vrijstaande woningen" veel voor, met ongeveer 222 woningen.
View more homes in this location.

6265BE Sint Geertruid
€ 479.000 k.k.
€ 3.281/m²

6265AW Sint Geertruid
€ 385.000 k.k.

6265AM Sint Geertruid
€ 369.000 k.k.

6265AV Sint Geertruid
€ 335.000 k.k.
€ 3.895/m²

6265AG Sint Geertruid
€ 380.000 k.k.
€ 2.968/m²

6265AP Sint Geertruid
€ 375.000 k.k.
€ 3.024/m²

6265BK Sint Geertruid
€ 545.000 k.k.
€ 4.780/m²

6265AC Sint Geertruid
€ 280.000 k.k.
€ 2.240/m²
