- Sold
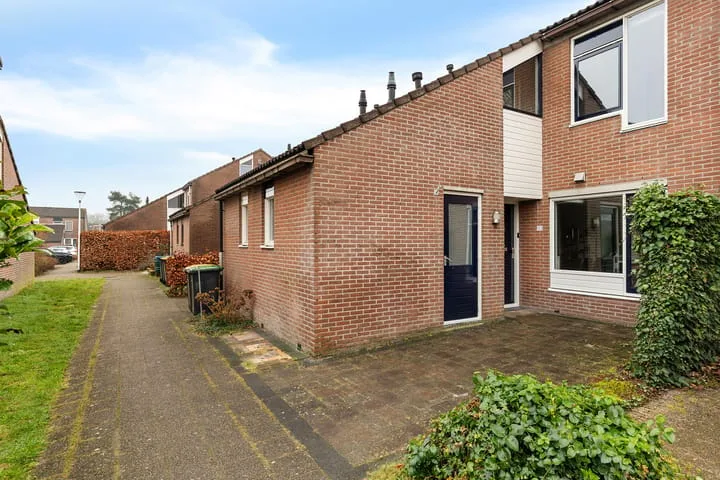
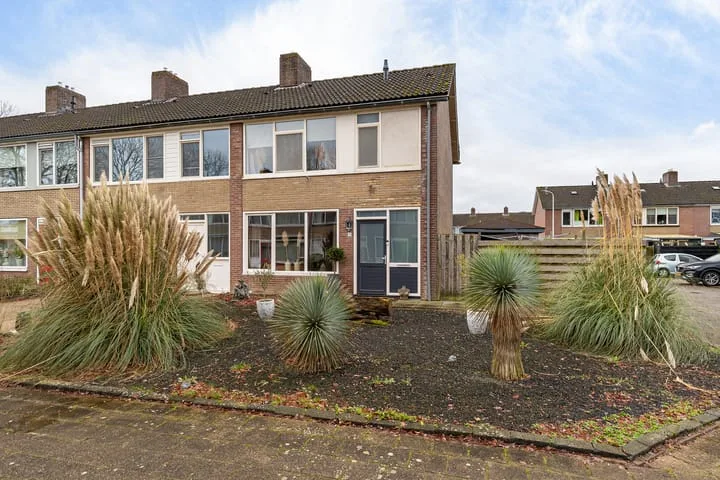
Kallenkoterallee 121
8331AC Steenwijk
€ 469.000 k.k.
€ 4.150/m²
- Living area
- 113 m²
- Land area
- 340 m²
- Bedrooms
- 3
View 195 sold houses in Steenwijk
Type to search. Use arrow down and arrow up to navigate through results and press Enter to open.
Hidden search suggestions.
Compare sold homes in Steenwijk or view the current offering in this location directly.
On this page you will find recently sold homes in Steenwijk. Use this overview to better estimate selling prices, popular neighborhoods, and the local housing supply before you choose a real estate agent. Also view the current housing supply with 248 houses in Steenwijk.
8331AC Steenwijk
€ 469.000 k.k.
€ 4.150/m²
8332KP Steenwijk
€ 365.000 k.k.
€ 3.650/m²
8332BG Steenwijk
€ 305.000 k.k.
€ 2.242/m²
8332AJ Steenwijk
€ 279.000 k.k.
€ 4.043/m²
8331GM Steenwijk
€ 615.000 k.k.
€ 3.455/m²
8333DC Steenwijk
€ 435.000 k.k.
€ 3.954/m²
8332CA Steenwijk
€ 280.000 k.k.
€ 2.828/m²
8333DC Steenwijk
€ 385.000 k.k.
€ 3.532/m²
8331JS Steenwijk
€ 250.000 k.k.
€ 3.676/m²
8332DC Steenwijk
€ 320.000 k.k.
€ 2.560/m²
8332KS Steenwijk
€ 375.000 k.k.
€ 4.870/m²
8332JG Steenwijk
€ 675.000 k.k.
€ 4.560/m²
8331JS Steenwijk
€ 250.000 k.k.
€ 3.676/m²
8332GW Steenwijk
€ 525.000 k.k.
€ 3.387/m²
8331SP Steenwijk
€ 280.000 k.k.
€ 3.636/m²
8333DH Steenwijk
€ 550.000 k.k.
€ 3.571/m²
8332JT Steenwijk
€ 425.000 k.k.
€ 3.512/m²
8331SX Steenwijk
€ 369.000 k.k.
€ 2.693/m²
8331GN Steenwijk
€ 625.000 k.k.
€ 3.511/m²
8332KW Steenwijk
€ 415.000 k.k.
€ 2.964/m²
8331SZ Steenwijk
€ 295.000 k.k.
€ 2.864/m²
8332AE Steenwijk
€ 325.000 k.k.
€ 2.256/m²
8332BD Steenwijk
€ 285.000 k.k.
€ 2.850/m²
8331KL Steenwijk
€ 315.000 k.k.
€ 3.579/m²
8332KK Steenwijk
€ 395.000 k.k.
€ 3.291/m²
8331NJ Steenwijk
€ 239.500 k.k.
€ 2.885/m²
8332KM Steenwijk
€ 365.000 k.k.
€ 3.119/m²
8332AT Steenwijk
€ 277.500 k.k.
€ 2.545/m²
Get free quotes from realtors with local market knowledge in Steenwijk.
Selling a home in Steenwijk? Compare real estate agents who know the local housing market. Also check out all real estate agents in Steenwijk or the top 10 real estate agents in Steenwijk for extra context for your choice.
By comparing brokers and requesting quotes
Short answers about housing prices, sold homes and comparing real estate agents in Steenwijk.
The costs of a real estate agent in Steenwijk vary per office, property type and sales approach. Therefore, compare multiple quotes and also look at the real estate agents in Steenwijk to better compare rates, presentation and local experience.
On this page we currently show 195 sold houses in Steenwijk from our selection. This helps you to better assess recent transactions and the local housing market.
Houses sold in Steenwijk give insight into asking prices, house types and neighborhoods where recent transactions have taken place. Compare this also with the current housing stock in Steenwijk to better understand the market.
You can use sold homes as a first market indication, but a local real estate agent can better take into account finishing, location, maintenance and current demand in Steenwijk.
Compare realtors in Steenwijk on local sales experience, reviews, expected yield, commission and marketing approach. The top 10 realtors in Steenwijk helps to quickly discover strong offices.
View current location data on residents, WOZ development, housing stock, energy consumption, business activity and safety in Steenwijk. In 2025 were there 17.620 residents. The average WOZ value in 2025 is EUR 286.000.
These figures help to better assess and compare the housing stock in Steenwijk with recent sold homes. Orient yourself then on suitable top real estate agents in Steenwijk for sales advice in this region.
Residents
17.620
Last year: 2025
Average WOZ
EUR 286.000
Last year: 2025
Average income per person.
EUR 30.300
Source: AllNumbers
Crimes (current year)
752
Total registered
| Year | Residents |
|---|---|
| 2021 | 17.110 |
| 2022 | 17.200 |
| 2023 | 17.495 |
| 2024 | 17.515 |
| 2025 | 17.620 |
| Year | Average WOZ |
|---|---|
| 2021 | EUR 201.000 |
| 2022 | EUR 223.000 |
| 2023 | EUR 259.000 |
| 2024 | EUR 273.000 |
| 2025 | EUR 286.000 |
Hoger
3.430
Praktisch
3.610
Middelbaar
5.860
Europa
895
Nederland
14.700
Buiten Europa
2.015
Label A
2.392
Label C
2.334
Label B
1.559
Label D
683
Label G
582
Label F
405
Label E
336
Label A+++
214
Label A+
188
Label A++++
181
Label A++
131
Label A+++++
3
| Year | Gas (m3) | Electricity (kWh) |
|---|---|---|
| 2020 | 1.180 | 2.470 |
| 2021 | 1.340 | 2.530 |
| 2022 | 1.050 | 2.410 |
| 2023 | 870 | 2.310 |
| 2024 | 840 | 2.380 |
Hoekwoning
Gas: 960 • Electricity: 2.390
Huurwoning
Gas: 750 • Electricity: 1.840
Koopwoning
Gas: 980 • Electricity: 2.720
Appartement
Gas: 650 • Electricity: 1.670
Tussenwoning
Gas: 860 • Electricity: 2.220
Vrijstaande woning
Gas: 1.180 • Electricity: 3.540
Twee-onder-één-kap woning
Gas: 960 • Electricity: 2.610
Total number of company establishments: 1.950
| Period | Crimes |
|---|---|
| jan 2025 | 58 |
| jan 2026 | 49 |
| jul 2025 | 62 |
| jun 2025 | 66 |
| mei 2025 | 71 |
| mrt 2025 | 57 |
| nov 2024 | 56 |
| nov 2025 | 54 |
| okt 2024 | 45 |
| okt 2025 | 78 |
| sep 2024 | 57 |
| sep 2025 | 76 |
These figures give an indicative picture of safety trends in the living environment of Steenwijk.
Short answers based on current local statistics, handy for a quick comparison of the living environment.
Steenwijk telt in 2025 ongeveer 17.620 inwoners.
De gemiddelde WOZ-waarde in Steenwijk is in 2025 circa € 286.000.
Het gemiddelde inkomen per inwoner in Steenwijk ligt rond € 30.300 per jaar.
Voor het huidige jaar gaat het om ongeveer 752 geregistreerde misdrijven. Gebruik deze cijfers als indicatie en vergelijk trends per periode.
In Steenwijk komt vooral "Tussenwoningen" veel voor, met ongeveer 2.702 woningen.