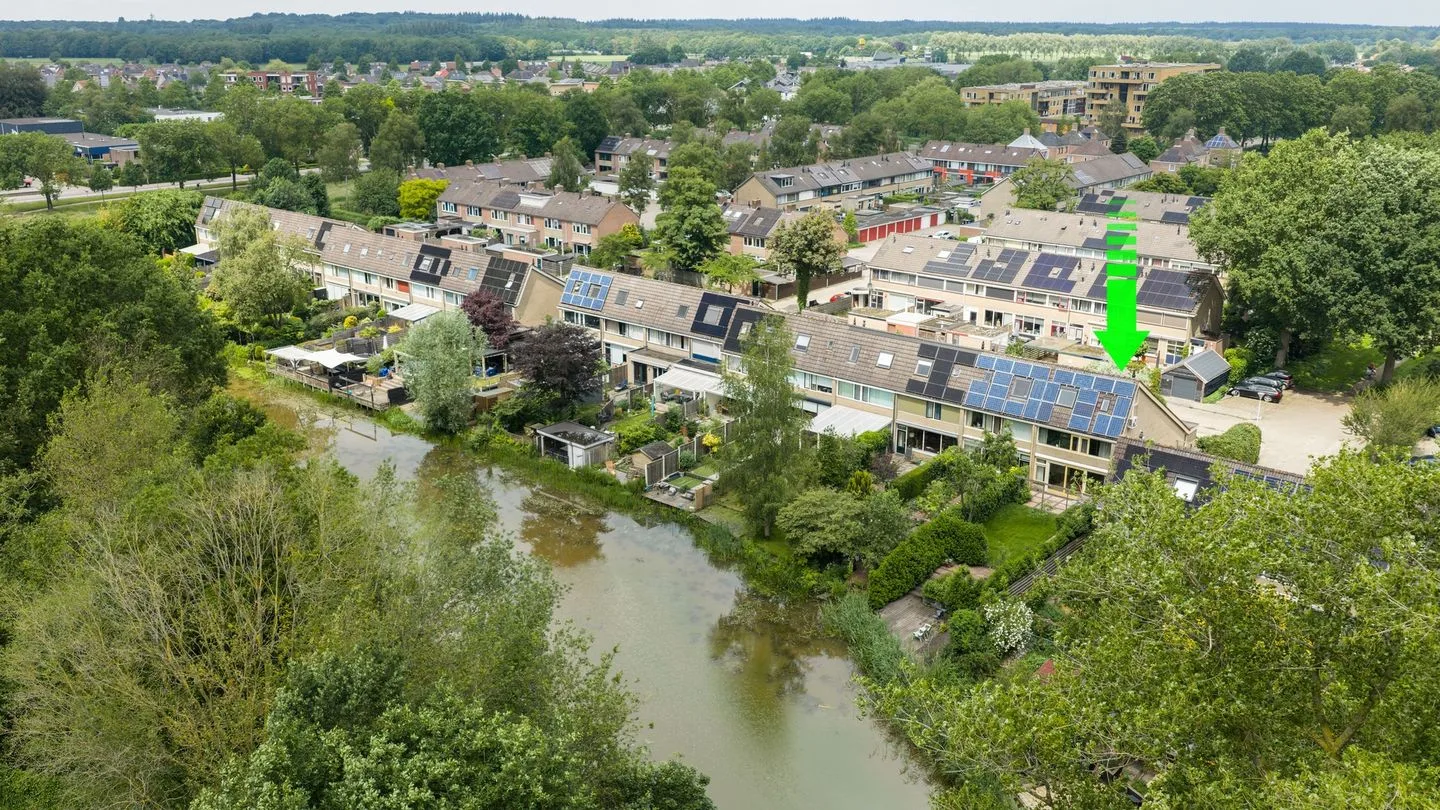
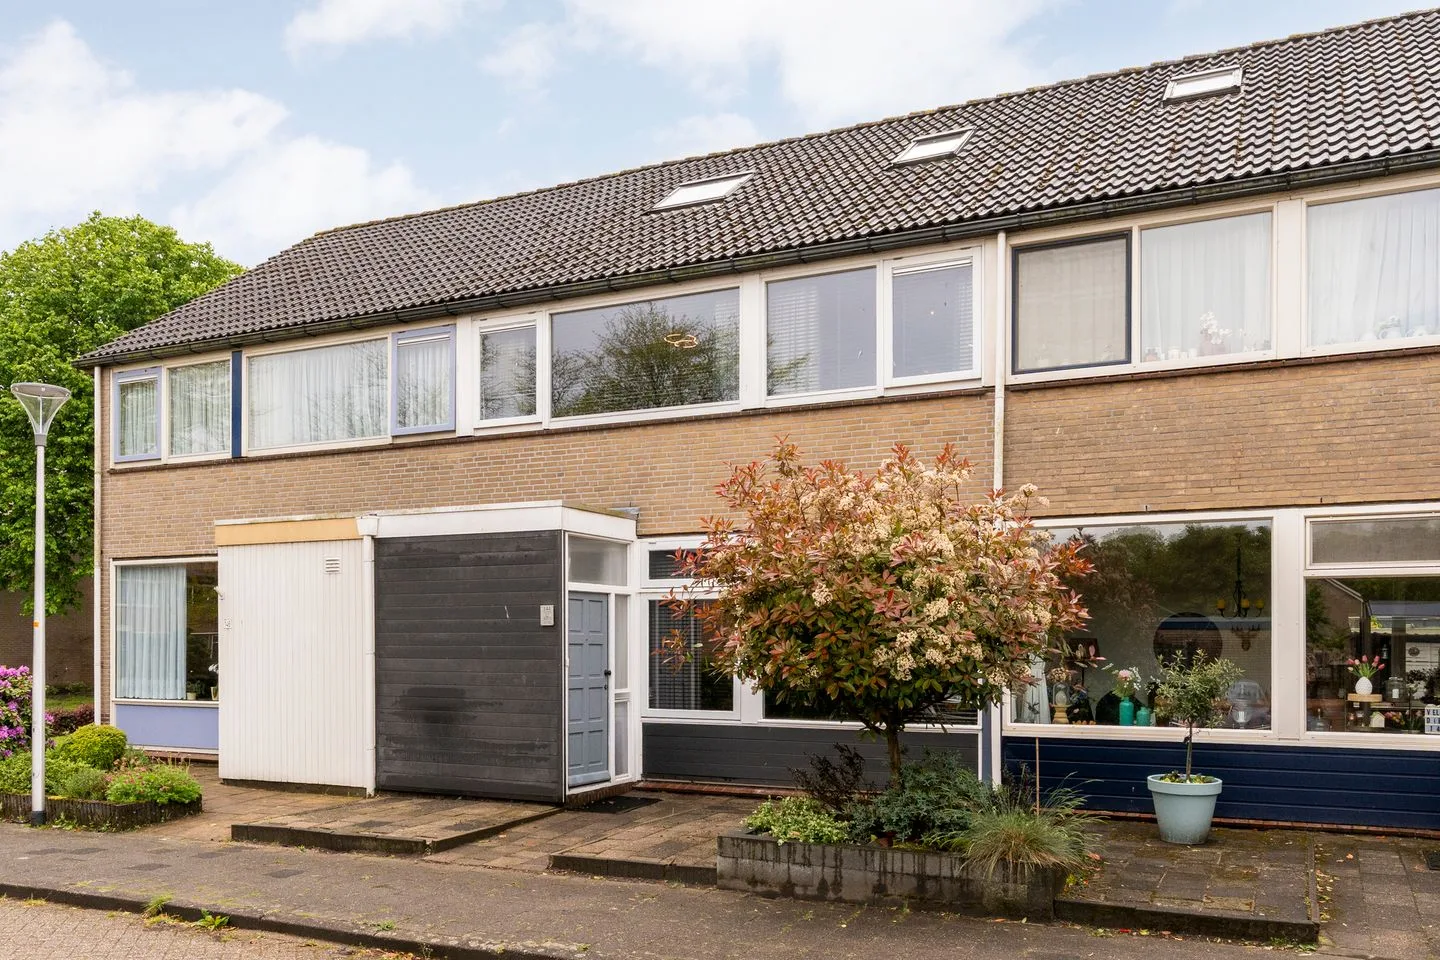
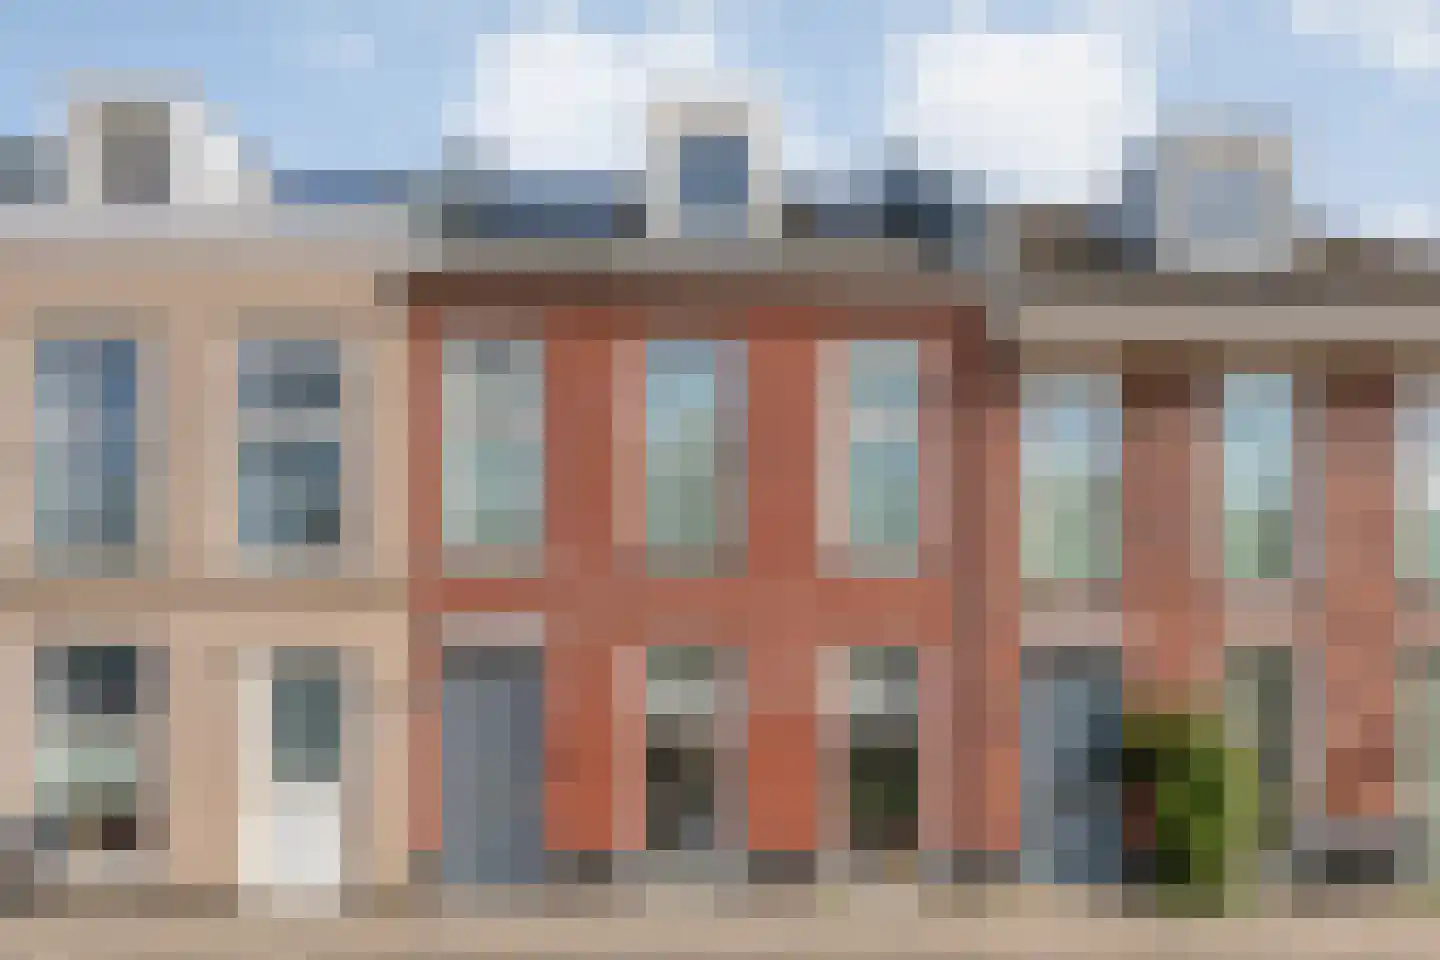
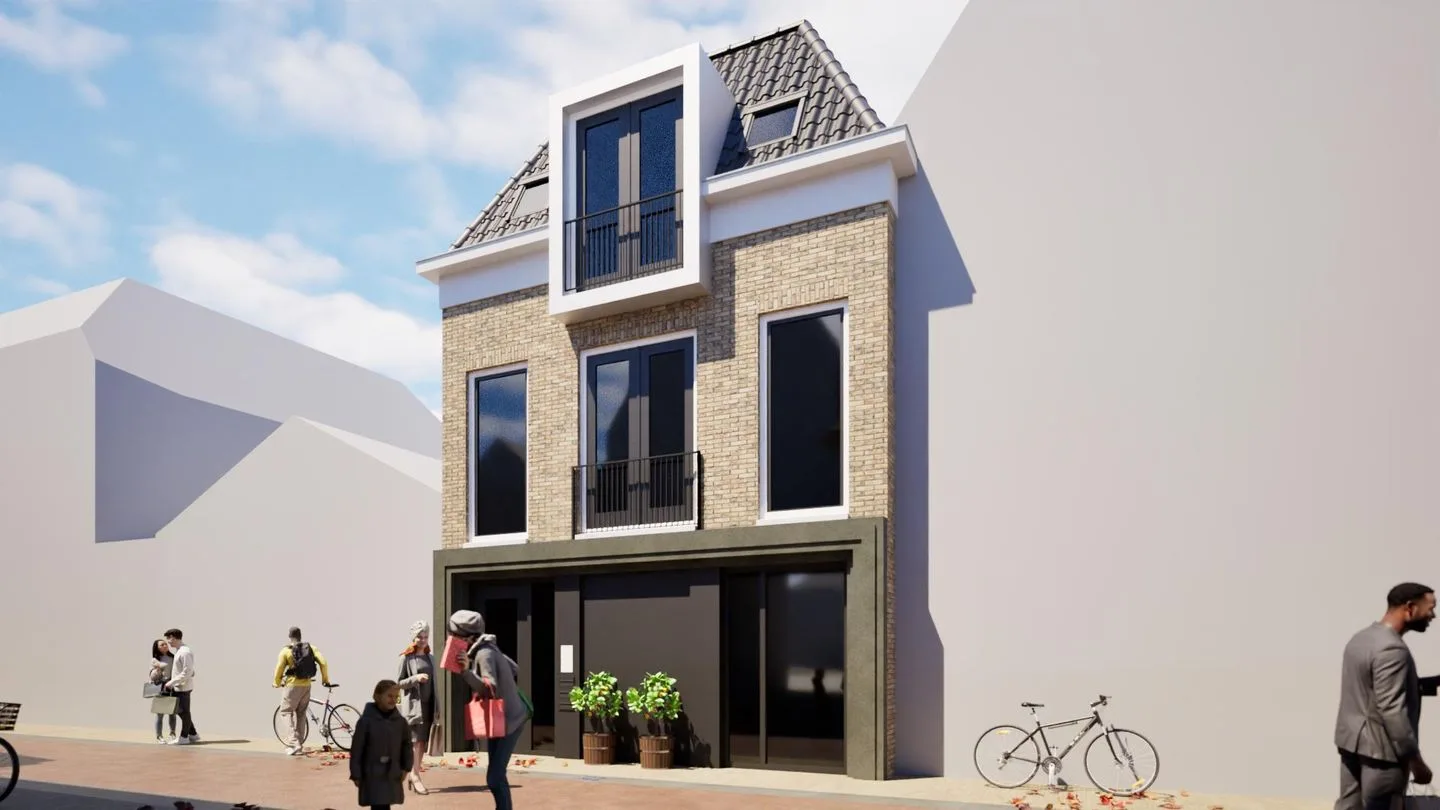
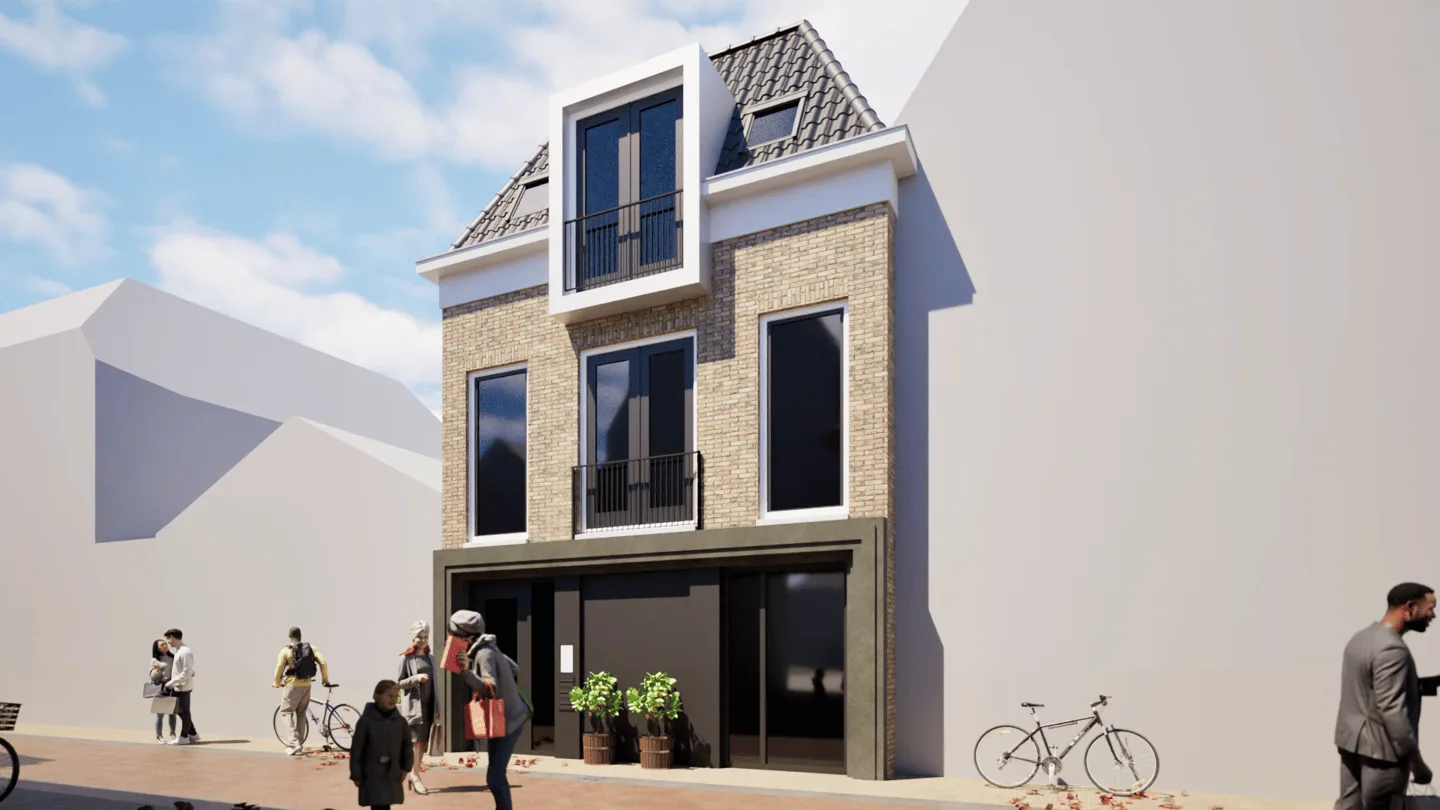
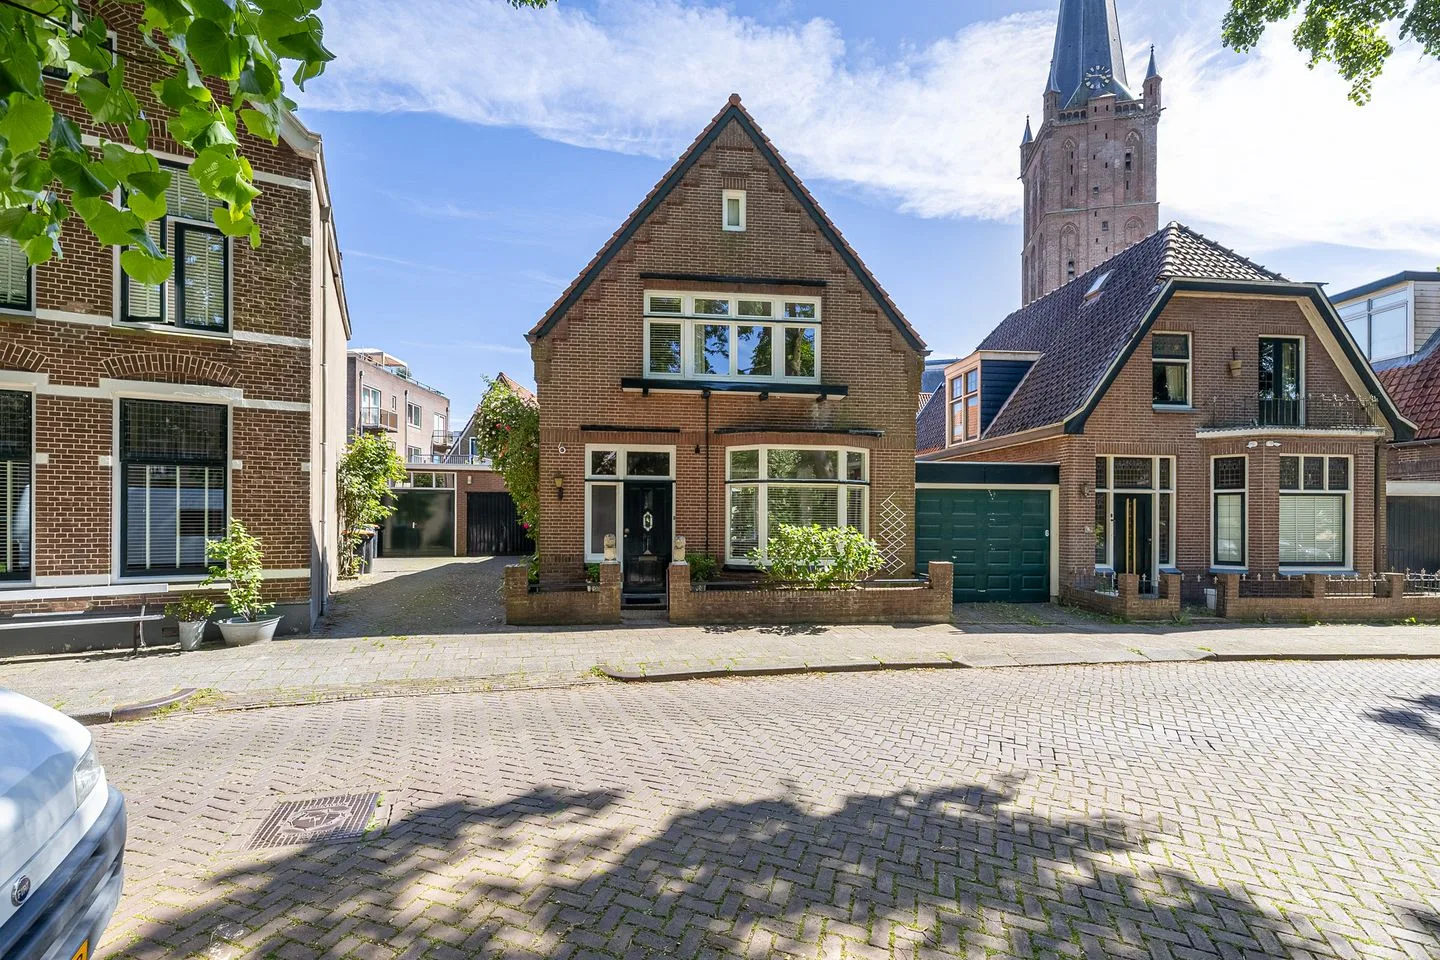
- Available
Noordersingel 5
8331KB Steenwijk
€ 525.000 k.k.
€ 3.671/m²
- Living area
- 143 m²
- Land area
- 154 m²
- Bedrooms
- 4
Searching in 247 houses in Steenwijk
Type to search. Use arrow down and arrow up to navigate through results and press Enter to open.
Hidden search suggestions.
View current properties in Steenwijk or search targeted on street, postal code and property characteristics.
View the current housing stock in Steenwijk and quickly filter by price, living area, rooms and more. There are currently 247 houses in this place within our selection. View also 188 sold houses in Steenwijk for extra insight into the local housing market.
8331KB Steenwijk
€ 525.000 k.k.
€ 3.671/m²
8332BG Steenwijk
€ 387.500 k.k.
€ 2.892/m²
8331PW Steenwijk
€ 379.000 k.k.
€ 3.989/m²
8331GE Steenwijk
€ 395.000 k.k.
€ 2.743/m²
8331LP Steenwijk
€ 395.000 k.k.
€ 3.465/m²
8332CL Steenwijk
€ 549.000 k.k.
€ 3.735/m²
8331KM Steenwijk
€ 495.000 k.k.
€ 6.037/m²
8332BB Steenwijk
€ 298.000 k.k.
€ 2.591/m²
8332JP Steenwijk
€ 549.000 k.k.
€ 3.229/m²
8331LN Steenwijk
€ 269.000 k.k.
€ 3.736/m²
8332BS Steenwijk
€ 339.000 k.k.
€ 2.387/m²
8331GM Steenwijk
€ 864 p/m
€ 19/m²
8331LB Steenwijk
€ 370.000 k.k.
€ 4.157/m²
8332JV Steenwijk
€ 475.000 k.k.
€ 3.598/m²
8332JG Steenwijk
€ 675.000 k.k.
€ 4.412/m²
8331JV Steenwijk
€ 275.000 k.k.
€ 3.929/m²
8332MC Steenwijk
€ 995.000 k.k.
€ 7.370/m²
8332BS Steenwijk
€ 475.000 k.k.
€ 2.794/m²
8331BL Steenwijk
€ 265.000 k.k.
€ 2.677/m²
8331LT Steenwijk
€ 384.000 k.k.
8332MC Steenwijk
€ 1.145.000 k.k.
8332EA Steenwijk
€ 798.000 k.k.
€ 3.205/m²
8332MC Steenwijk
€ 1.425.000 k.k.
€ 5.258/m²
8331LB Steenwijk
€ 375.000 k.k.
€ 2.885/m²
8332GT Steenwijk
€ 525.000 k.k.
8331JX Steenwijk
€ 415.000 k.k.
€ 3.051/m²
8331JL Steenwijk
€ 340.000
€ 4.048/m²
8331JL Steenwijk
€ 309.000
€ 4.478/m²
Get free quotes from real estate agents with local market knowledge. Compare more than 26 real estate agents in Steenwijk.
Selling a home in Steenwijk? View the sales-oriented guide sell a house in Steenwijk, compare all real estate agents in Steenwijk or view the top 10 real estate agents in Steenwijk for extra context to your choice.
Real estate agents make sharper offers when they know you're comparing — ask for quotes for sale or purchase.
Practical answers about housing supply, sales and comparing real estate agents in Steenwijk.
The costs of a real estate agent in Steenwijk depend on commission, setup costs, property presentation and the chosen service. Compare the 26 real estate agents in Steenwijk via the real estate agent page and request multiple quotes to compare rates and approach well.
Within our selection, we are currently showing 247 houses in Steenwijk. View also the sold houses in Steenwijk to compare the current offering with recent transactions.
Take into account not only price and living area but also maintenance, energy label, location, outdoor space and sales status. This way you compare houses in Steenwijk on more than just the asking price.
A local real estate agent knows the neighborhoods, recent transactions and demand in Steenwijk. By comparing 26 real estate agents in the region you get a better insight into prices, sales strategy and expected yield; the top 10 in Steenwijk provides a useful starting point.
Yes, when making a sales plan, a valuation in Steenwijk is wise. You gain insight into a realistic asking price and can then compare offers from real estate agents specifically.
View current location data on residents, WOZ development, housing stock, energy consumption, business activity and safety in Steenwijk. In 2026 were there 17.592 residents. The average WOZ value in 2025 is EUR 286.000.
These figures help to better assess and compare the housing stock in Steenwijk with recent sold homes. Orient yourself then on suitable top real estate agents in Steenwijk for sales advice in this region.
Residents
17.592
Last year: 2026
Average WOZ
EUR 286.000
Last year: 2025
Average income per person.
EUR 30.300
Source: AllNumbers
Crimes (current year)
752
Total registered
| Year | Residents |
|---|---|
| 2021 | 17.110 |
| 2022 | 17.200 |
| 2023 | 17.495 |
| 2024 | 17.515 |
| 2025 | 17.620 |
| 2026 | 17.592 |
| Year | Average WOZ |
|---|---|
| 2021 | EUR 201.000 |
| 2022 | EUR 223.000 |
| 2023 | EUR 259.000 |
| 2024 | EUR 273.000 |
| 2025 | EUR 286.000 |
Hoger
3.430
Praktisch
3.610
Middelbaar
5.860
Europa
895
Nederland
14.700
Buiten Europa
2.015
Label A
2.392
Label C
2.334
Label B
1.559
Label D
683
Label G
582
Label F
405
Label E
336
Label A+++
214
Label A+
188
Label A++++
181
Label A++
131
Label A+++++
3
| Year | Gas (m3) | Electricity (kWh) |
|---|---|---|
| 2020 | 1.180 | 2.470 |
| 2021 | 1.340 | 2.530 |
| 2022 | 1.050 | 2.410 |
| 2023 | 870 | 2.310 |
| 2024 | 840 | 2.380 |
Hoekwoning
Gas: 960 • Electricity: 2.390
Huurwoning
Gas: 750 • Electricity: 1.840
Koopwoning
Gas: 980 • Electricity: 2.720
Appartement
Gas: 650 • Electricity: 1.670
Tussenwoning
Gas: 860 • Electricity: 2.220
Vrijstaande woning
Gas: 1.180 • Electricity: 3.540
Twee-onder-één-kap woning
Gas: 960 • Electricity: 2.610
Total number of company establishments: 1.950
| Period | Crimes |
|---|---|
| jan 2026 | 49 |
| jul 2025 | 62 |
| jun 2025 | 66 |
| mei 2025 | 71 |
| mrt 2025 | 57 |
| mrt 2026 | 59 |
| nov 2024 | 56 |
| nov 2025 | 54 |
| okt 2024 | 45 |
| okt 2025 | 78 |
| sep 2024 | 57 |
| sep 2025 | 76 |
These figures give an indicative picture of safety trends in the living environment of Steenwijk.
Short answers based on current local statistics, handy for a quick comparison of the living environment.
Steenwijk telt in 2026 ongeveer 17.592 inwoners.
De gemiddelde WOZ-waarde in Steenwijk is in 2025 circa € 286.000.
Het gemiddelde inkomen per inwoner in Steenwijk ligt rond € 30.300 per jaar.
Voor het huidige jaar gaat het om ongeveer 752 geregistreerde misdrijven. Gebruik deze cijfers als indicatie en vergelijk trends per periode.
In Steenwijk komt vooral "Tussenwoningen" veel voor, met ongeveer 2.702 woningen.