- Sold
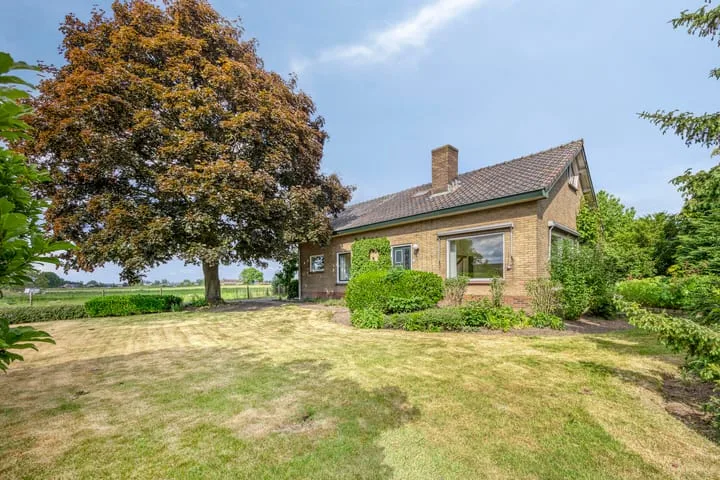
Wethouder Spekkinkstraat 7
7227DV Toldijk
€ 385.000 k.k.
€ 3.632/m²
- Living area
- 106 m²
- Land area
- 274 m²
- Bedrooms
- 4
View 6 sold houses in Toldijk
Type to search. Use arrow down and arrow up to navigate through results and press Enter to open.
Hidden search suggestions.
Compare sold homes in Toldijk or view the current offering in this location directly.
On this page you will find recently sold homes in Toldijk. Use this overview to better estimate selling prices, popular neighborhoods, and the local housing supply before you choose a real estate agent. Also view the current housing supply with 8 houses in Toldijk.
7227DV Toldijk
€ 385.000 k.k.
€ 3.632/m²
7227NJ Toldijk
€ 795.000 k.k.
€ 0/m²
7227DA Toldijk
Price upon request
7227DL Toldijk
€ 595.000 k.k.
€ 3.940/m²
7227DB Toldijk
€ 375.000 k.k.
€ 3.099/m²
7227DS Toldijk
€ 450.000 k.k.
€ 3.214/m²
Bekijk recente verkopen en ontvang gratis offertes van lokale makelaars. Vergelijk meer dan 21 makelaars in Toldijk.
Zelf je woning verkopen in Toldijk? Vergelijk verkoopmakelaars in Toldijk of bekijk de beste verkoopmakelaars in Toldijk als referentie bij jouw keuze.
Makelaars maken scherpere voorstellen als ze weten dat je vergelijkt — vraag offertes aan voor verkoop of aankoop.
Short answers about housing prices, sold homes and comparing real estate agents in Toldijk.
De kosten van een makelaar in Toldijk verschillen per kantoor, woningtype en verkoopaanpak. In Toldijk kun je 21 real estate agents vergelijken; bekijk daarom ook de makelaars in Toldijk om tarieven, presentatie en lokale ervaring beter naast elkaar te zetten.
On this page we currently show 6 sold houses in Toldijk from our selection. This helps you to better assess recent transactions and the local housing market.
Houses sold in Toldijk give insight into asking prices, house types and neighborhoods where recent transactions have taken place. Compare this also with the current housing stock in Toldijk to better understand the market.
You can use sold homes as a first market indication, but a local real estate agent can better take into account finishing, location, maintenance and current demand in Toldijk.
Vergelijk de 21 real estate agents in Toldijk op lokale verkoopervaring, reviews, verwachte opbrengst, courtage en marketingaanpak. Bekijk verkoopmakelaars in Toldijk of de top 10 makelaars in Toldijk om snel sterke kantoren te ontdekken.
View current location data on residents, WOZ development, housing stock, energy consumption, business activity and safety in Toldijk. In 2026 were there 893 residents. The average WOZ value in 2025 is EUR 469.375.
These figures help to better assess and compare the housing stock in Toldijk with recent sold homes. Orient yourself then on suitable top real estate agents in Toldijk for sales advice in this region.
Residents
893
Last year: 2026
Average WOZ
EUR 469.375
Last year: 2025
Average income per person.
EUR 30.636
Source: AllNumbers
Crimes (current year)
13
Total registered
| Year | Residents |
|---|---|
| 2021 | 890 |
| 2022 | 895 |
| 2023 | 915 |
| 2024 | 910 |
| 2025 | 890 |
| 2026 | 893 |
| Year | Average WOZ |
|---|---|
| 2021 | EUR 351.500 |
| 2022 | EUR 388.847 |
| 2023 | EUR 448.062 |
| 2024 | EUR 465.358 |
| 2025 | EUR 469.375 |
Hoger
70
Praktisch
50
Middelbaar
300
Europa
20
Nederland
840
Buiten Europa
35
Label G
107
Label C
75
Label F
44
Label B
37
Label A
34
Label D
34
Label E
26
Label A+
4
Label A+++
2
Label A++++
2
Label A++
1
Label A+++++
0
| Year | Gas (m3) | Electricity (kWh) |
|---|---|---|
| 2020 | 1.737 | 3.938 |
| 2021 | 1.974 | 3.913 |
| 2022 | 1.571 | 3.806 |
| 2023 | 1.271 | 3.561 |
| 2024 | 1.227 | 3.578 |
Hoekwoning
Gas: 398 • Electricity: 1.256
Huurwoning
Gas: 1.133 • Electricity: 2.761
Koopwoning
Gas: 1.304 • Electricity: 3.743
Appartement
Gas: 1.300 • Electricity: 3.132
Tussenwoning
Gas: 363 • Electricity: 1.142
Vrijstaande woning
Gas: 1.411 • Electricity: 3.986
Twee-onder-één-kap woning
Gas: 1.139 • Electricity: 3.328
Total number of company establishments: 170
| Period | Crimes |
|---|---|
| jan 2026 | 0 |
| jul 2025 | 0 |
| jun 2025 | 1 |
| mei 2025 | 0 |
| mrt 2025 | 2 |
| mrt 2026 | 1 |
| nov 2024 | 3 |
| nov 2025 | 2 |
| okt 2024 | 0 |
| okt 2025 | 2 |
| sep 2024 | 2 |
| sep 2025 | 0 |
These figures give an indicative picture of safety trends in the living environment of Toldijk.
Short answers based on current local statistics, handy for a quick comparison of the living environment.
Toldijk telt in 2026 ongeveer 893 inwoners.
De gemiddelde WOZ-waarde in Toldijk is in 2025 circa € 469.375.
Het gemiddelde inkomen per inwoner in Toldijk ligt rond € 30.636 per jaar.
Voor het huidige jaar gaat het om ongeveer 13 geregistreerde misdrijven. Gebruik deze cijfers als indicatie en vergelijk trends per periode.
In Toldijk komt vooral "Vrijstaande woningen" veel voor, met ongeveer 175 woningen.