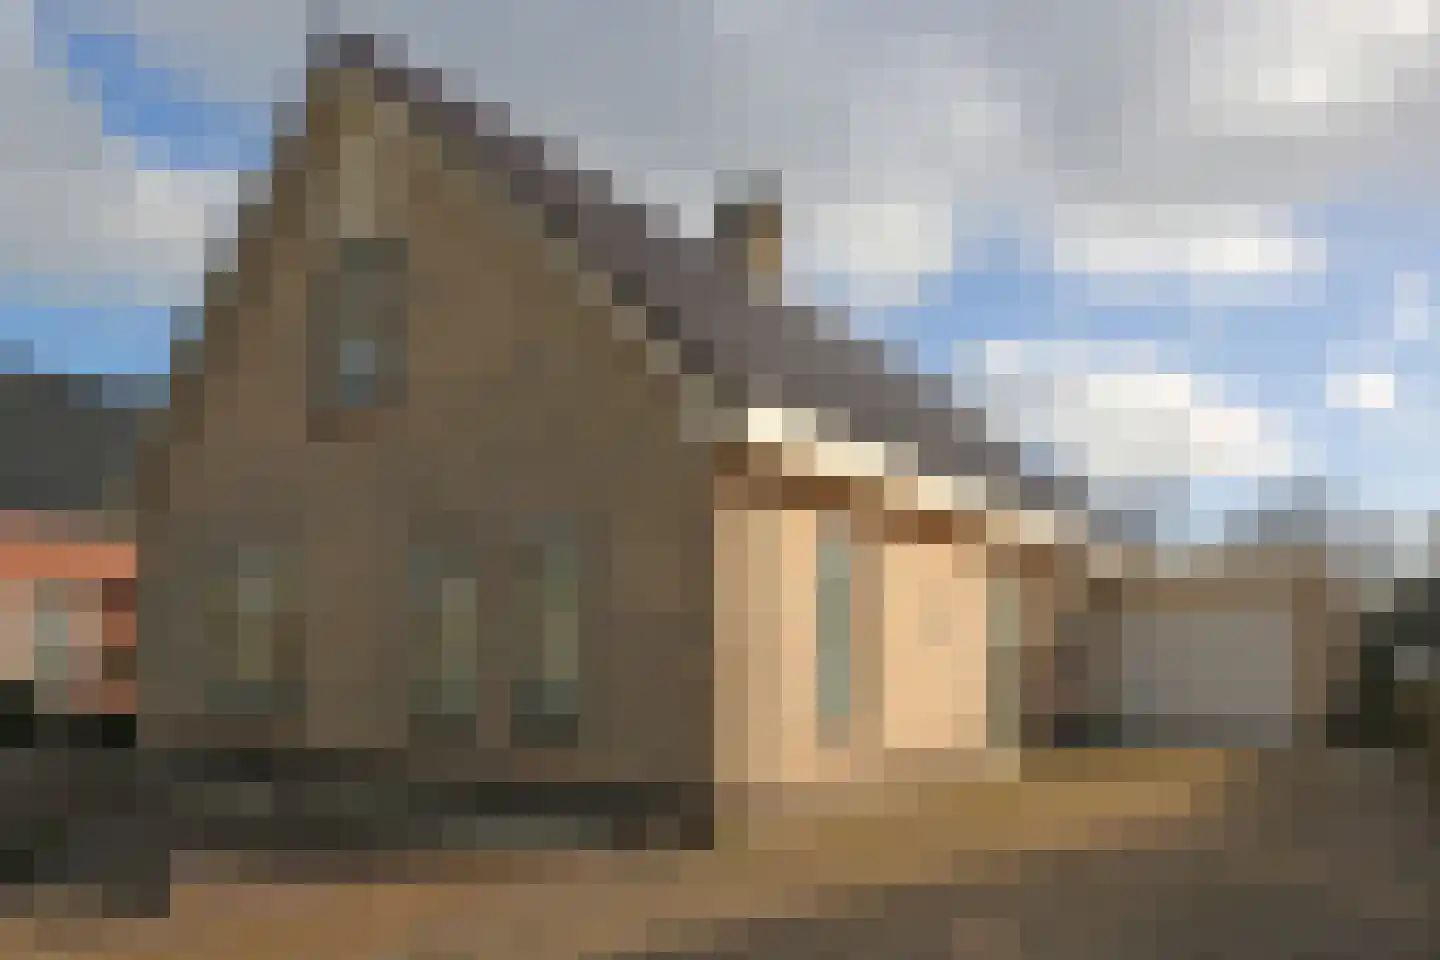
Houses sold in Twijzel

View 5 sold houses in Twijzel

Connected to: Vastgoed Nederland NVM Makelaars

On this page you will find recently sold homes in Twijzel. Use this overview to better estimate selling prices, popular neighborhoods, and the local housing supply before you choose a real estate agent. Also view the current housing supply with 9 houses in Twijzel.

Selection

Search and filter homes

Set your preferences and discover homes that suit you.

Total supply 243.172
Filters

Set price, area and other characteristics. Adjust a filter or click on Show homes. Location changes directly above.

Reset filters

You search for

  • Place Twijzel
  • Status Sold

Sell your house in Twijzel? Compare real estate agents

View recent sales and receive free quotes from local real estate agents. Compare more than 16 real estate agents in Twijzel.

Free request a quote

  • Quotes in Twijzel
  • Non-binding
  • Personal
  • Compare free rates

Selling your own home in Twijzel? Compare real estate agents in Twijzel or view the best real estate agents in Twijzel as a reference for your choice.

Compare multiple quotes

Real estate agents make sharper offers when they know you're comparing — ask for quotes for sale or purchase.

Frequently asked questions about sold homes in Twijzel

Short answers about housing prices, sold homes and comparing real estate agents in Twijzel.

Residential and neighborhood statistics in Twijzel

View current location data on residents, WOZ development, housing stock, energy consumption, business activity and safety in Twijzel. In 2026 were there 1.137 residents. The average WOZ value in 2025 is EUR 306.127.

These figures help to better assess and compare the housing stock in Twijzel with recent sold homes. Orient yourself then on suitable top real estate agents in Twijzel for sales advice in this region.

Residents

1.137

Last year: 2026

Average WOZ

EUR 306.127

Last year: 2025

Average income per person.

EUR 24.475

Source: AllNumbers

Crimes (current year)

34

Total registered

Demographics and WOZ development

Inhabitants per year

Inhabitants per year in Twijzel
Year Residents
2021 1.085
2022 1.065
2023 1.095
2024 1.115
2025 1.145
2026 1.137

Annual WOZ value

WOZ value per year in Twijzel
Year Average WOZ
2021 EUR 209.835
2022 EUR 227.011
2023 EUR 256.391
2024 EUR 279.721
2025 EUR 306.127

Composition of residents

Age build-up

65+: 240 0-15: 150 15-25: 155 25-45: 290 45-65: 325

Education level

Hoger

100

Praktisch

340

Middelbaar

360

Origin of residents (2025)

Europa

60

Nederland

1.045

Buiten Europa

30

Housing stock and construction periods

Types of homes

Hoekwoningen 43
Appartementen 22
Tussenwoningen 49
Vrijstaande woningen 277
Twee-onder-één-kap woningen 81

Construction period of buildings

Voor 1700 1
1700 tot 1900 17
1900 tot 1925 98
1925 tot 1950 62
1950 tot 1970 77
1970 tot 1980 89
1980 tot 1990 45
1990 tot 2000 33
2000 tot 2010 23
2010 tot 2020 5
2020 en later 21

Energy and sustainability

Energy label distribution

Label G

142

Label B

82

Label C

80

Label D

49

Label A

43

Label F

33

Label E

18

Label A++

7

Label A+

6

Label A+++

3

Label A++++

1

Label A+++++

0

Average energy consumption per year

Average energy consumption per year in Twijzel
Year Gas (m3) Electricity (kWh)
2020 1.614 3.167
2021 1.836 3.285
2022 1.444 3.040
2023 1.151 2.991
2024 1.103 3.044

Consumption per house type

Hoekwoning

Gas: 921 • Electricity: 1.714

Huurwoning

Gas: 949 • Electricity: 2.082

Koopwoning

Gas: 1.199 • Electricity: 3.264

Appartement

Gas: 783 • Electricity: 1.889

Tussenwoning

Gas: 866 • Electricity: 1.916

Vrijstaande woning

Gas: 1.304 • Electricity: 3.420

Twee-onder-één-kap woning

Gas: 829 • Electricity: 2.506

Business activity in Twijzel (2025)

Handel en HORECA 45
Nijverheid en energie 50
Zakelijke dienstverlening 15
Overheid, onderwijs en zorg 15
Landbouw, bosbouw en visserij 20
Vervoer, informatie en communicatie 0
Financiele diensten en onroerendgoed 10
Cultuur, recreatie en overige diensten 10

Total number of company establishments: 175

Recent crime statistics

Recent crime statistics in Twijzel
Period Crimes
jan 2026 3
jul 2025 1
jun 2025 1
mei 2025 1
mrt 2025 4
mrt 2026 3
nov 2024 1
nov 2025 6
okt 2024 2
okt 2025 1
sep 2024 1
sep 2025 2

These figures give an indicative picture of safety trends in the living environment of Twijzel.

Frequently asked questions about living in Twijzel

Short answers based on current local statistics, handy for a quick comparison of the living environment.

Hoeveel inwoners heeft Twijzel?

Twijzel telt in 2026 ongeveer 1.137 inwoners.

Wat is de gemiddelde WOZ-waarde in Twijzel?

De gemiddelde WOZ-waarde in Twijzel is in 2025 circa € 306.127.

Wat is het gemiddelde inkomen per inwoner in Twijzel?

Het gemiddelde inkomen per inwoner in Twijzel ligt rond € 24.475 per jaar.

Hoe veilig is wonen in Twijzel?

Voor het huidige jaar gaat het om ongeveer 34 geregistreerde misdrijven. Gebruik deze cijfers als indicatie en vergelijk trends per periode.

Welke woningtypen komen het meest voor in Twijzel?

In Twijzel komt vooral "Vrijstaande woningen" veel voor, met ongeveer 277 woningen.

Receive free, non-binding quotes

Compare multiple real estate agents and choose the best match.