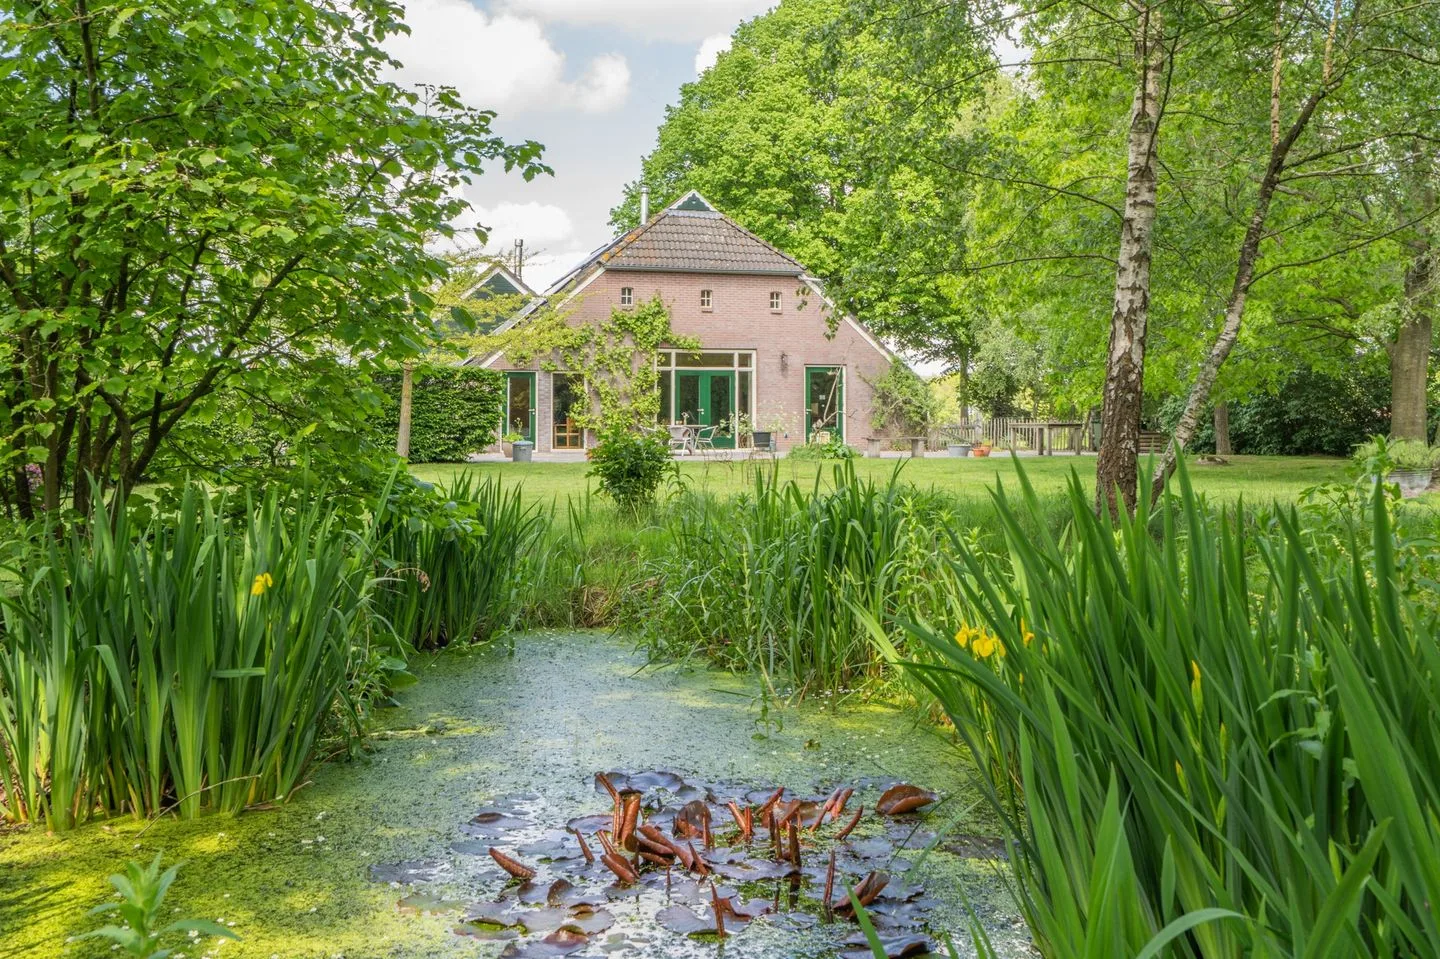
Housing offer in Ubbena

Searching in 2 houses in Ubbena

Connected to: Vastgoed Nederland NVM Makelaars

View the current housing stock in Ubbena and quickly filter by price, living area, rooms and more. There are currently 2 houses in this place within our selection.

Selection

Search and filter homes

Set your preferences and discover homes that suit you.

Total supply 242.647
Filters

Set price, area and other characteristics. Adjust a filter or click on Show homes. Location changes directly above.

Reset filters

You search for

  • Place Ubbena

Selling a home in Ubbena? Compare realtor offers

Get free quotes from real estate agents with local market knowledge. Compare more than 36 real estate agents in Ubbena.

Free request a quote

  • Quotes in Ubbena
  • Non-binding
  • Personal
  • Compare free rates

Selling a home in Ubbena? Compare all real estate agents in Ubbena or view the top 10 real estate agents in Ubbena for extra context for your choice.

Compare multiple quotes

Real estate agents make sharper offers when they know you're comparing — ask for quotes for sale or purchase.

Frequently asked questions about homes in Ubbena

Practical answers about housing supply, sales and comparing real estate agents in Ubbena.

Residential and neighborhood statistics in Ubbena

View current location data on residents, WOZ development, housing stock, energy consumption, business activity and safety in Ubbena. In 2025 were there 180 residents. The average WOZ value in 2025 is EUR 406.543.

These figures help to better assess and compare the housing stock in Ubbena with recent sold homes. Orient yourself then on suitable top real estate agents in Ubbena for sales advice in this region.

Residents

180

Last year: 2025

Average WOZ

EUR 406.543

Last year: 2025

Average income per person.

-

Source: AllNumbers

Crimes (current year)

5

Total registered

Demographics and WOZ development

Inhabitants per year

Inhabitants per year in Ubbena
Year Residents
2021 175
2022 170
2023 170
2024 165
2025 180

Annual WOZ value

WOZ value per year in Ubbena
Year Average WOZ
2021 EUR 312.364
2022 EUR 341.455
2023 EUR 382.441
2024 EUR 398.217
2025 EUR 406.543

Composition of residents

Age build-up

65+: 30 0-15: 30 15-25: 20 25-45: 40 45-65: 60

Education level

Hoger

10

Praktisch

40

Middelbaar

20

Origin of residents (2025)

Europa

0

Nederland

160

Buiten Europa

10

Housing stock and construction periods

Types of homes

Appartementen 6
Tussenwoningen 3
Vrijstaande woningen 60
Twee-onder-één-kap woningen 2

Construction period of buildings

Voor 1700 0
1700 tot 1900 6
1900 tot 1925 21
1925 tot 1950 19
1950 tot 1970 10
1970 tot 1980 4
1980 tot 1990 6
1990 tot 2000 3
2000 tot 2010 3
2010 tot 2020 0
2020 en later 5

Energy and sustainability

Energy label distribution

Label G

31

Label C

9

Label B

6

Label D

6

Label F

5

Label A

4

Label E

3

Label A+

1

Label A++

1

Label A+++

0

Label A++++

0

Label A+++++

0

Average energy consumption per year

Average energy consumption per year in Ubbena
Year Gas (m3) Electricity (kWh)
2020 2.106 4.112
2021 2.473 4.285
2022 1.851 3.784
2023 1.347 3.361
2024 1.324 3.694

Consumption per house type

Huurwoning

Gas: 799 • Electricity: 1.526

Koopwoning

Gas: 1.337 • Electricity: 3.327

Appartement

Gas: 528 • Electricity: 1.698

Vrijstaande woning

Gas: 1.434 • Electricity: 3.546

Recent crime statistics

Recent crime statistics in Ubbena
Period Crimes
jan 2025 0
jan 2026 1
jul 2025 1
jun 2025 1
mei 2025 1
mrt 2025 1
nov 2024 1
nov 2025 0
okt 2024 1
okt 2025 0
sep 2024 0
sep 2025 1

These figures give an indicative picture of safety trends in the living environment of Ubbena.

Frequently asked questions about living in Ubbena

Short answers based on current local statistics, handy for a quick comparison of the living environment.

Hoeveel inwoners heeft Ubbena?

Ubbena telt in 2025 ongeveer 180 inwoners.

Wat is de gemiddelde WOZ-waarde in Ubbena?

De gemiddelde WOZ-waarde in Ubbena is in 2025 circa € 406.543.

Hoe veilig is wonen in Ubbena?

Voor het huidige jaar gaat het om ongeveer 5 geregistreerde misdrijven. Gebruik deze cijfers als indicatie en vergelijk trends per periode.

Welke woningtypen komen het meest voor in Ubbena?

In Ubbena komt vooral "Vrijstaande woningen" veel voor, met ongeveer 60 woningen.

Receive free, non-binding quotes

Compare multiple real estate agents and choose the best match.