Residents
10.541
Last year: 2026
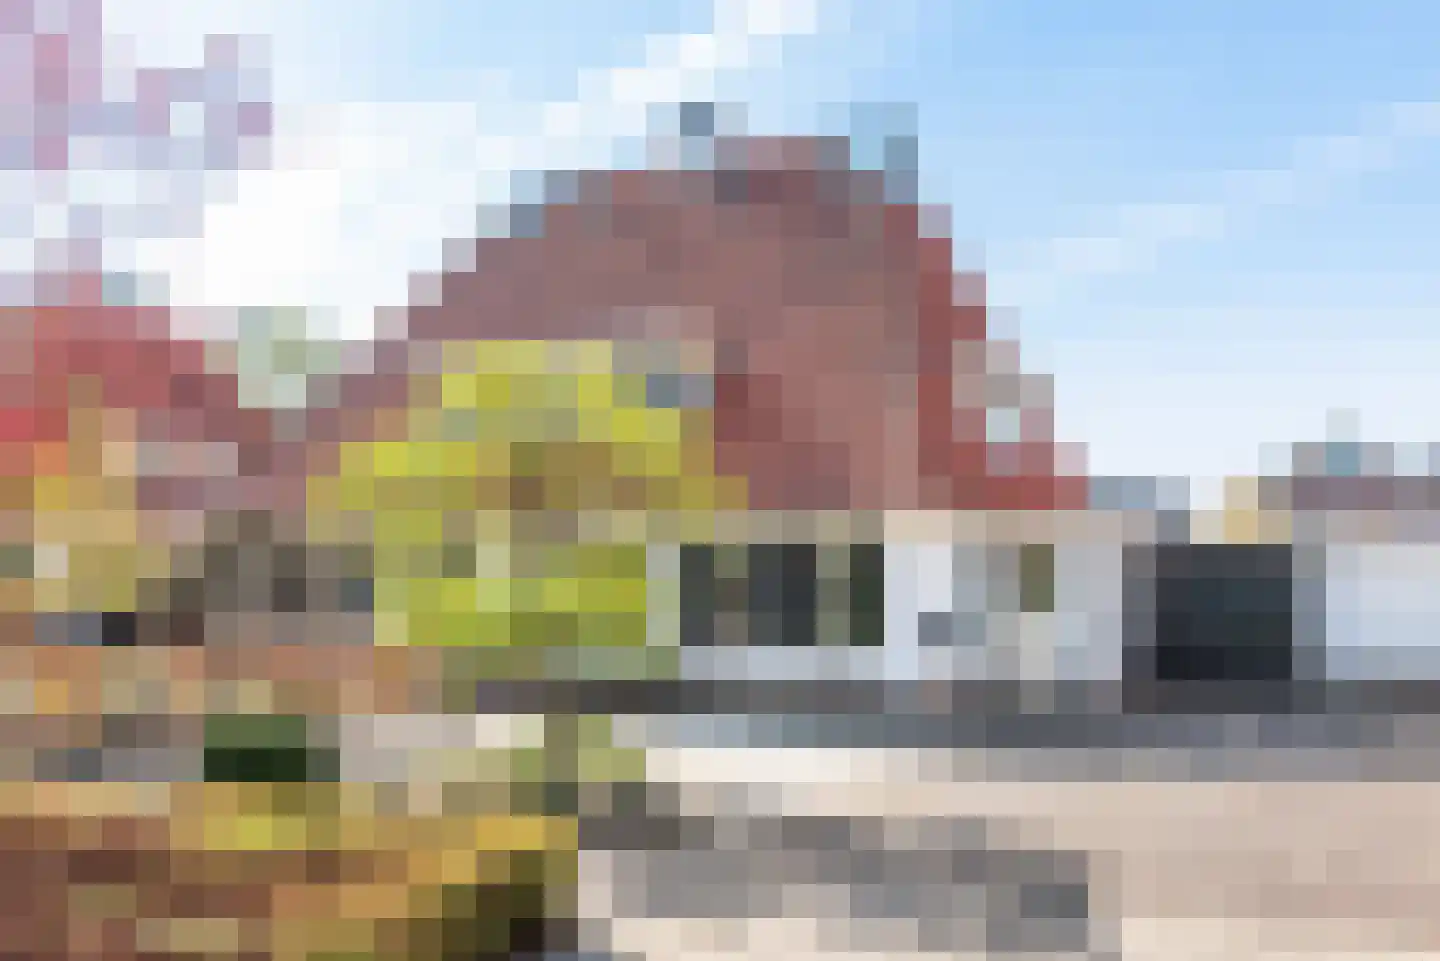
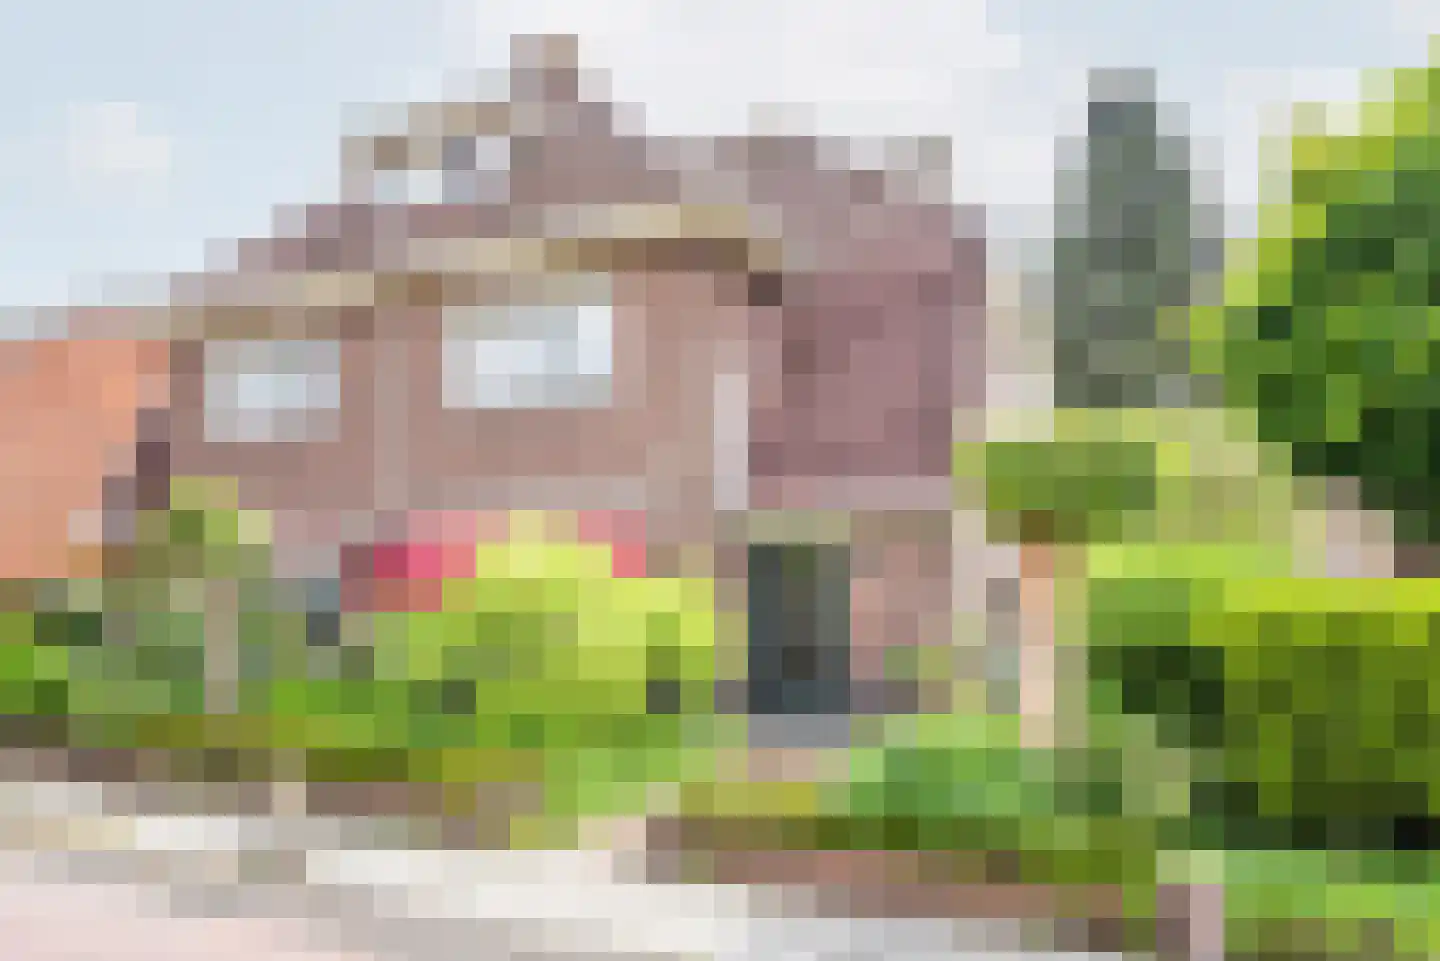
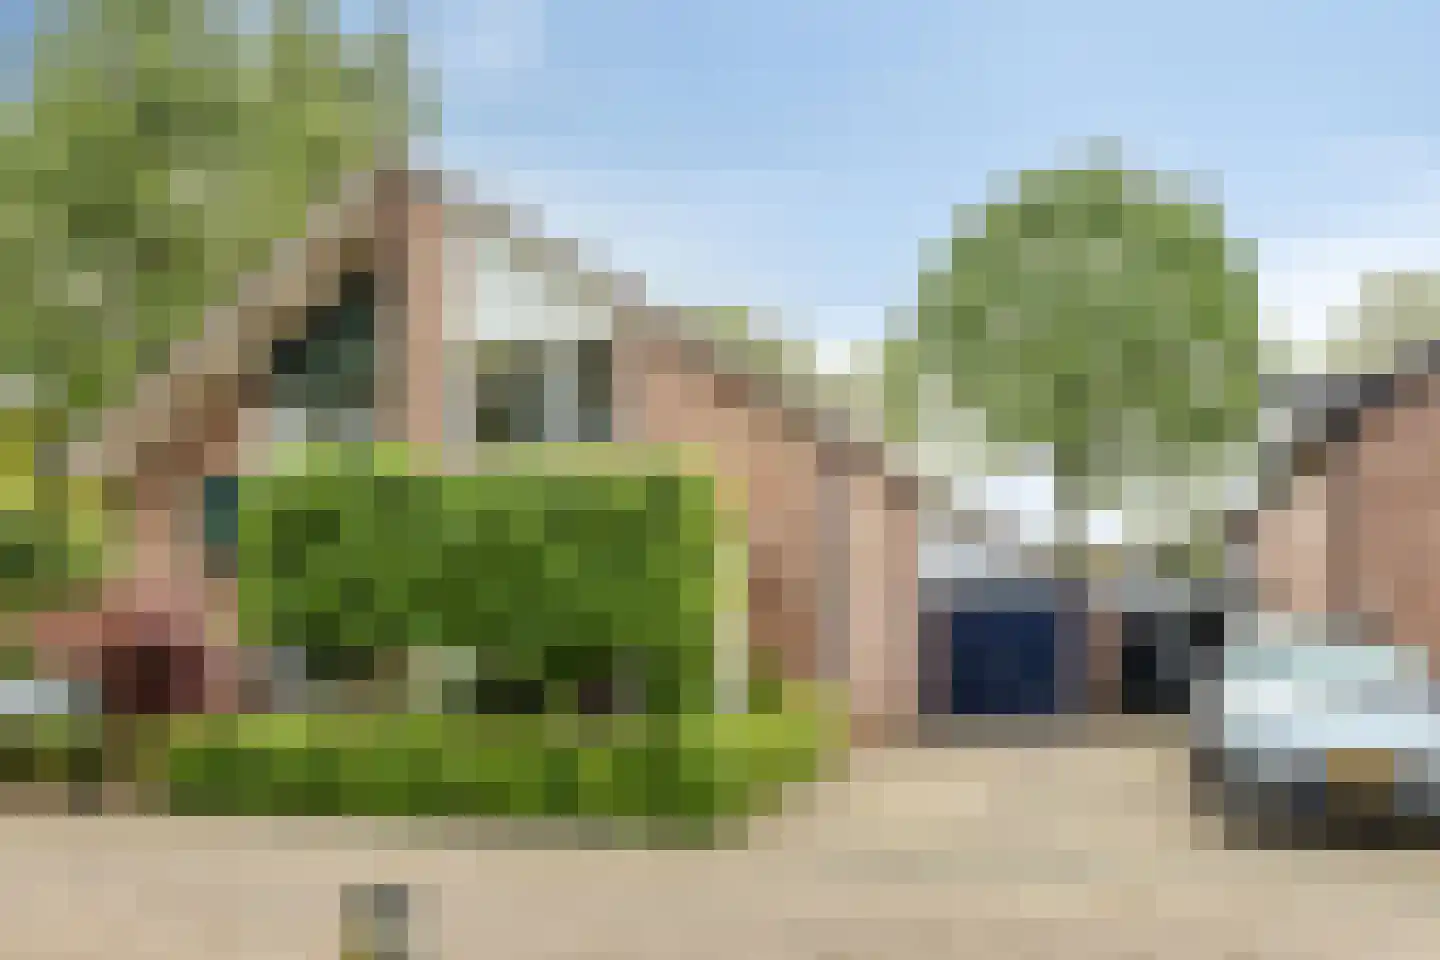
7071GD Ulft • Gelderland
€ 475.000 k.k.
Cost of copper (estimated): € 11.350
2% transfer tax (€ 9.500) + notary (€ 1.150) + valuation (€ 700)
Total incl. VAT: € 486.350
Purchase price /m²: € 3.571
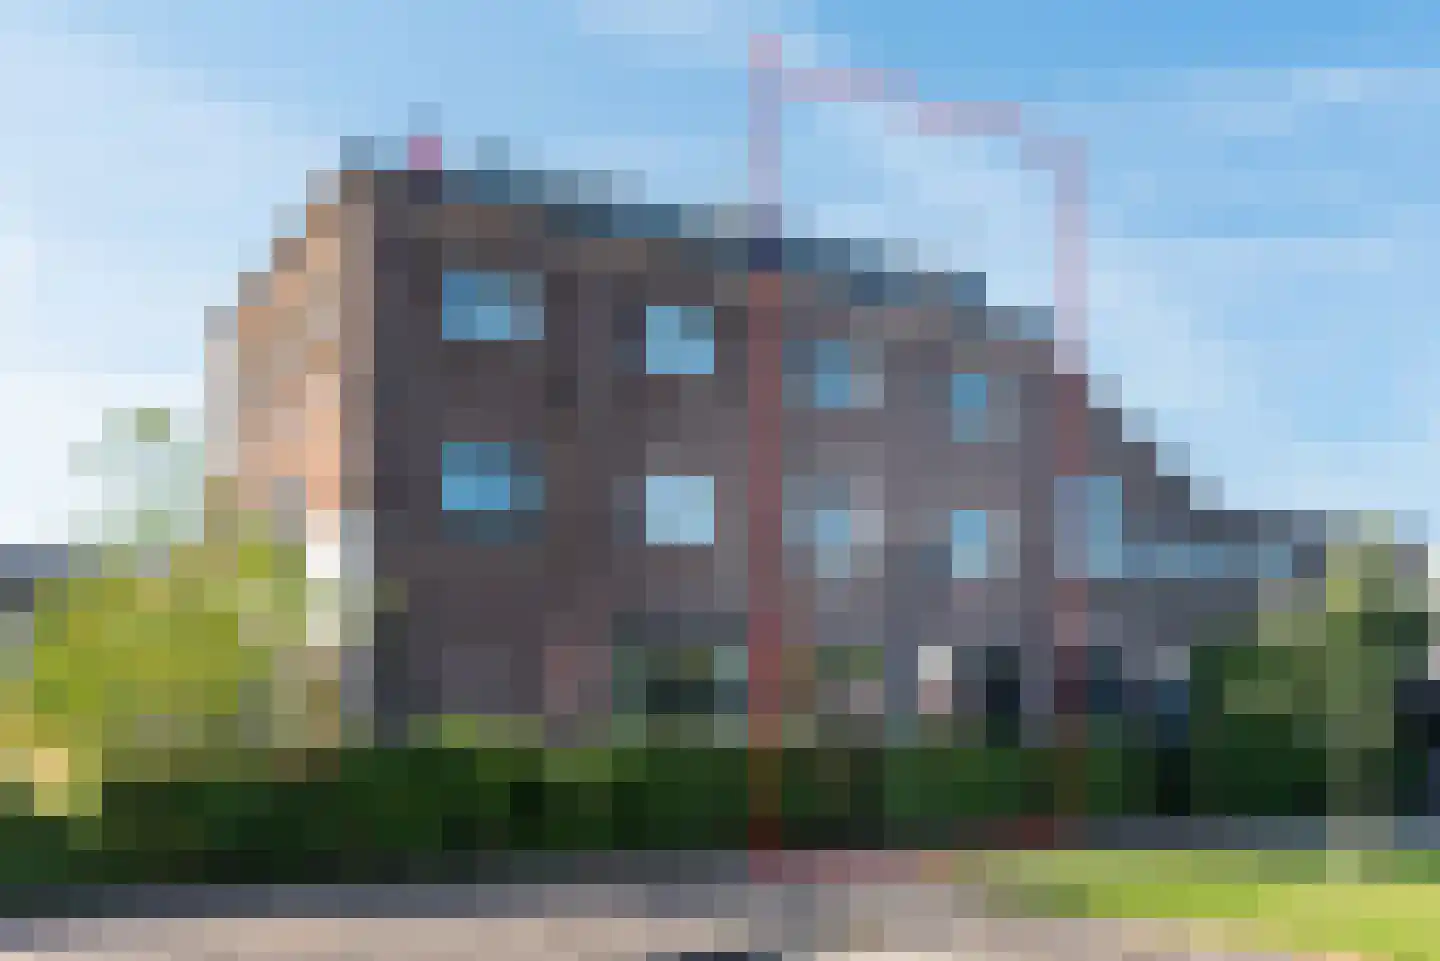
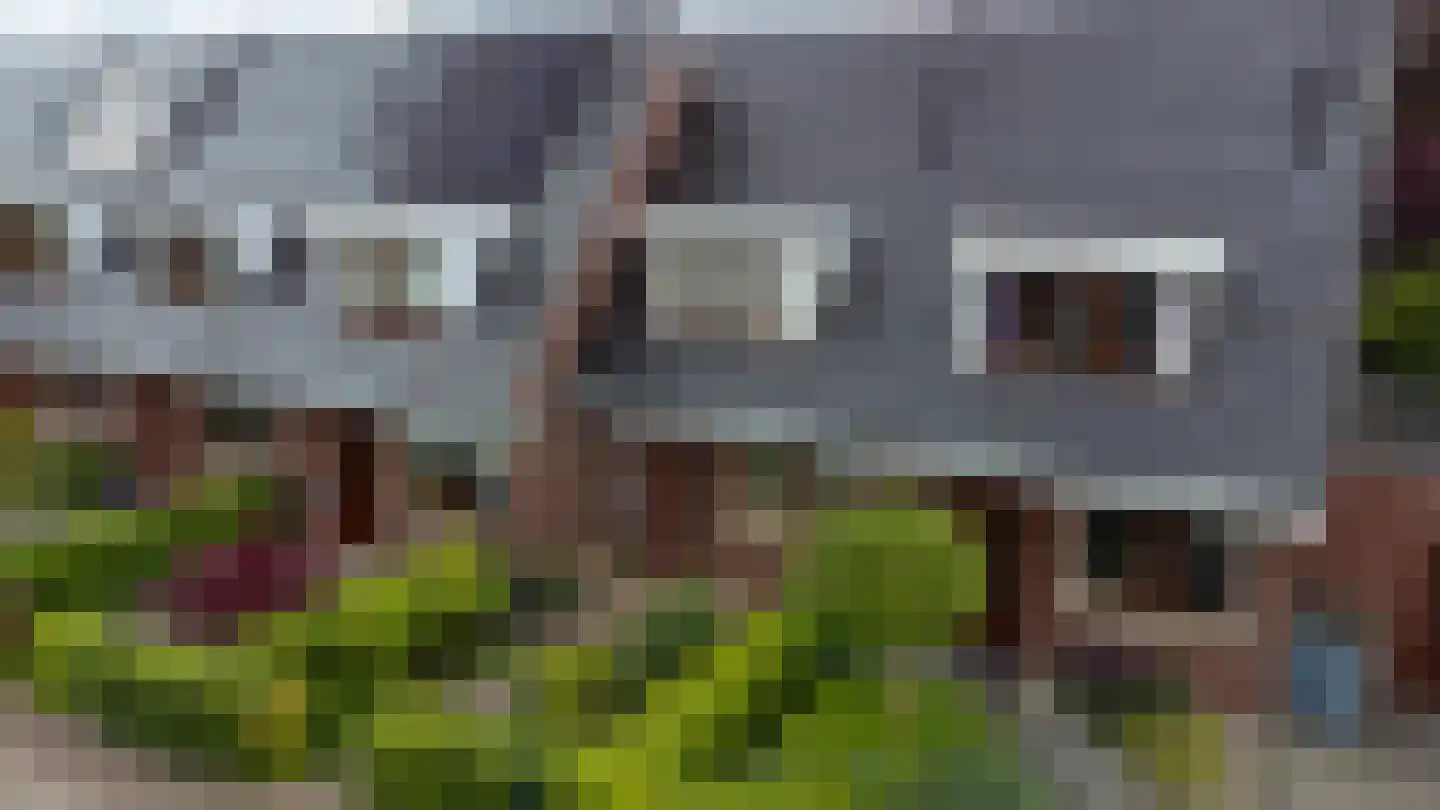
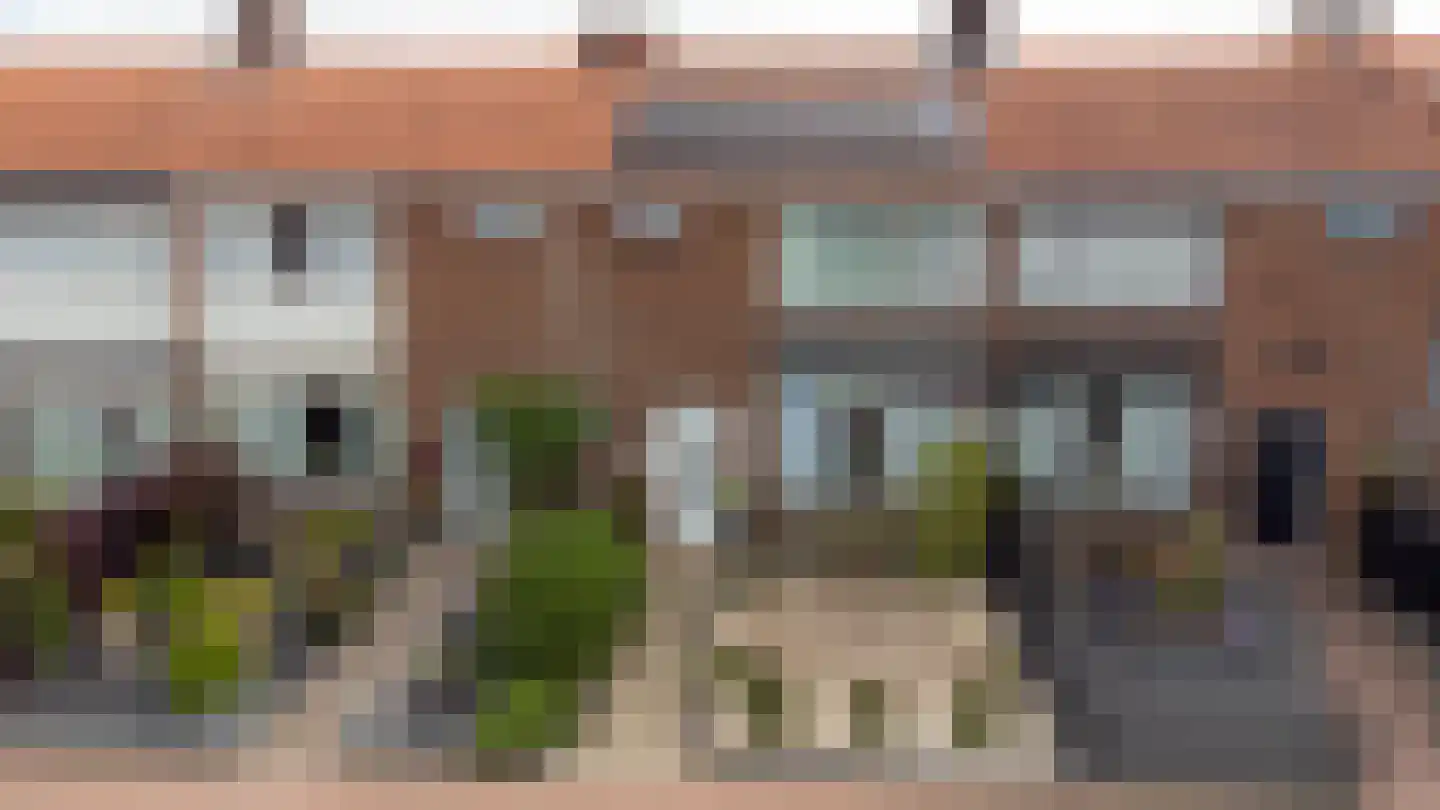
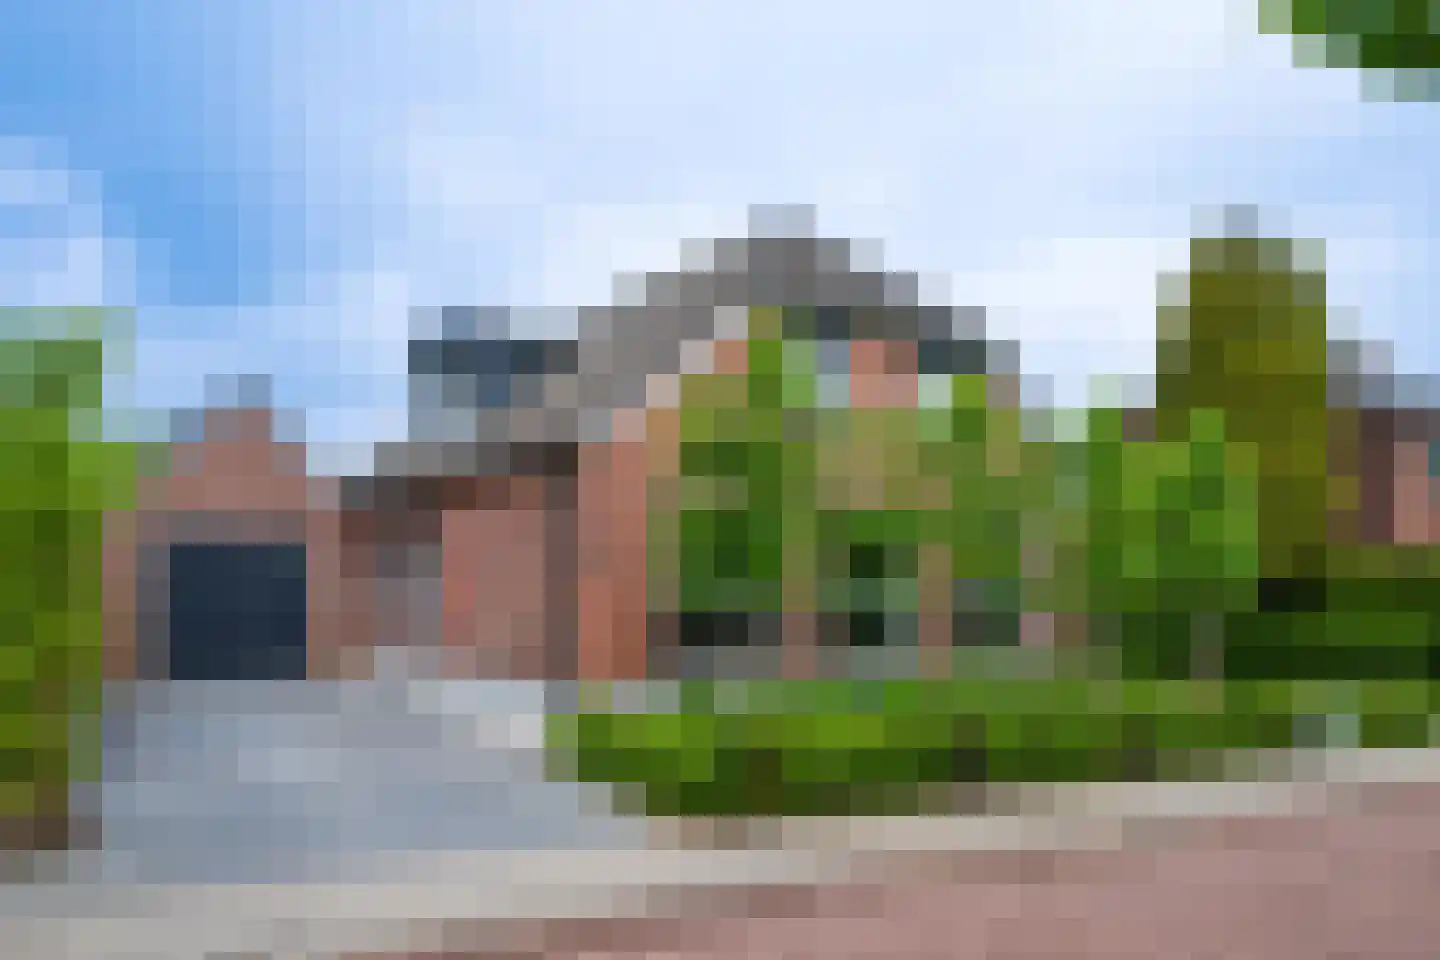
Aan de Hogeweg 2 C in Ulft staat deze charmante en statige twee-onder-een-kapwoning uit 1997. De woning is volledig geïsoleerd en voorzien van 8 zonnepanelen (circa 2023) en 2 airco’s (circa 2023), wat zorgt voor een comfortabel en energiezuinig woonklimaat. Met een praktische indeling en volop leefruimte is dit een ideale gezinswoning met diverse mogelijkheden. Met een woonoppervlakte van circa 133 m² en een aangebouwde garage van circa 19 m² beschik je hier over verrassend veel ruimte. De garage is voorzien van water en elektra en biedt daarnaast plaats voor de wasmachine en droger. Ook buiten is het goed toeven dankzij de fraaie overkapping van circa 18 m² (geplaatst in circa 2023). Praktisch detail: de dakbedekking van de garage is in circa 2024 vernieuwd en die van de dakkapellen in circa 2023. De groene ligging zorgt voor een prettige, rustige woonomgeving. De woning heeft een verzorgde uitstraling en biedt een solide basis die je eenvoudig naar eigen wens kunt aanpassen. Een fijne plek voor wie comfortabel en toekomstgericht wil wonen! Is je interesse gewekt? Bekijk dan snel de virtuele bezichtiging op onze website! Indeling: De voortuin is keurig aangelegd en de oprit biedt meer dan voldoende ruimte aan twee auto’s, drie auto’s is ook mogelijk. In het verlengde hiervan bereik je zowel de garage als de voordeur. Binnenkomst is via de entree, die toegang geeft tot de garage en de living. De begane grond is verrassend ruim en slim ingedeeld. Aan de voorzijde bevindt zich de woonkeuken, uitgevoerd met een spoeleiland en een gezellig barretje. De keuken is tweedelig en voorzien van diverse inbouwapparatuur, waaronder een vaatwasser, combi-oven, 5-pits gaskookplaat en afzuigkap. Hier kook en leef je in een prettige, open sfeer. De eetkamer en woonkamer zijn samengevoegd tot een royale leefruimte met veel lichtinval, mede dankzij de grote glazen (schuif)pui aan de tuinzijde. Dit zorgt voor een fijne verbinding met buiten. De living is bovendien voorzien van een airco en een praktische trapkast. Via de woonkeuken kom je in een extra hal, waar zich de trapopgang naar de eerste verdieping bevindt, evenals een modern toilet met fontein, de meterkast (met glasvezelaansluiting) en een compacte werkruimte of nis – ideaal als thuiswerkplek. Op de eerste verdieping kom je via de overloop, die eveneens is voorzien van airco, bij drie slaapkamers. De ouderlijke slaapkamer beschikt over rolluiken, wat zorgt voor extra comfort en verduistering. De badkamer is compleet uitgevoerd met een wastafelmeubel, ligbad, douche, toilet en mechanische ventilatie. De tweede verdieping betreft een ruime zolder, bereikbaar via een vaste trap. Hier vind je een dak- of nokraam, de cv-installatie, de mechanische ventilatiebox en de omvormer voor de zonnepanelen. Deze verdieping biedt daarnaast volop bergruimte en eventueel mogelijkheden voor verdere invulling. De achtertuin is een heerlijke plek om te ontspannen. Gelegen op het zuiden en fraai omheind met volle, hoge beukenhagen, geniet je hier van optimale privacy. De tuin is verzorgd aangelegd met een combinatie van terras en gazon. De overkapping maakt het geheel compleet: een fijne plek om het hele jaar door buiten te zitten, ongeacht het weer. Kortom, een ruime en goed onderhouden woning met een prettige indeling, moderne voorzieningen en volop mogelijkheden om het geheel naar eigen wens verder te personaliseren. Bijzonderheden: Gebouwd omstreeks 1997 De inhoud van de woning is circa 450 m³ en de woonoppervlakte circa 133 m² Aangebouwde garage is circa 19 m² en de fraaie overkapping is circa 18 m² De perceeloppervlakte is 341 m² Gelegen in een rustige, groene woonomgeving Oprit met plaats voor twee auto’s Zonnige, privacyvolle achtertuin op het zuiden Moderne woonkeuken met spoeleiland en bar Ruime living met veel lichtinval en schuifpui naar de tuin Drie slaapkamers en complete badkamer Dakbedekking garage vernieuwd in circa 2024 en dakkapellen in circa 2023 Volledig geïsoleerd en voorzien van 8 zonnepanelen van circa 2023 Twee airco’s van circa 2023 voor extra comfort Energielabel B Aanvaarding in overleg Locatie Ulft is met ruim 10.000 inwoners de grootste plaats binnen de gemeente Oude IJsselstreek. Deze gemeente ligt in de prachtige Achterhoek en heeft een oppervlakte van zo'n 140 vierkante kilometer en er wonen bijna 40.000 inwoners. De rivier de Oude IJssel slingert zich dwars door dit gebied en leverde vroeger het ijzer voor de ijzersmelterijen (Pelgrim, ATAG, DRU). Tegenwoordig biedt de rivier tal van recreatiemogelijkheden en maakt de Oude IJsselstreek een prettig gebied om in te wonen. Ulft heeft een winkelcentrum met meerdere supermarkten en landelijke ketens zoals HEMA en Action. Ook op het gebied van onderwijs en gezondheidszorg is het dorp goed voorzien. Er is een levendig verenigingsleven en de voormalige DRU fabriek is nu een populair cultureel centrum met tal van activiteiten, zoals concerten, festivals, theater- en filmvoorstellingen en exposities. Ulft is goed bereikbaar via de A18, de N317 en vanuit Duitsland over de A3 en ook de busverbindingen zijn goed. Ben je benieuwd hoe de woning voor jou werkelijk aanvoelt, dan is een real life bezichtiging de volgende stap. Aarzel niet en bel ons voor een vrijblijvende bezichtiging met een van onze makelaars.
€ 475.000
Cost of copper (estimated): € 11.350
2% transfer tax (€ 9.500) + notary (€ 1.150) + valuation (€ 700)
Total purchase (incl. p.p.): € 486.350
3,21%
Yearly
€ 23.750
Direct available
Estimated mortgage
Indicative gross monthly cost
Based on annuity and 30 year term
Indicative net monthly cost
iDisclaimer: this mortgage calculation is a simplified indication based on general assumptions. No rights can be derived from the results shown. Calculated with 10-annual interest (zonder NHG), automatically determined based on the price limit € 470.000. Source: 10-jaars rente uit mortgage_rates (09-06-2026 03:45). For non-NHG, an 80% mortgage of the market value has been used in this indication.
Douche, ligbad, toilet, en wastafelmeubel
Elektra en stromend water
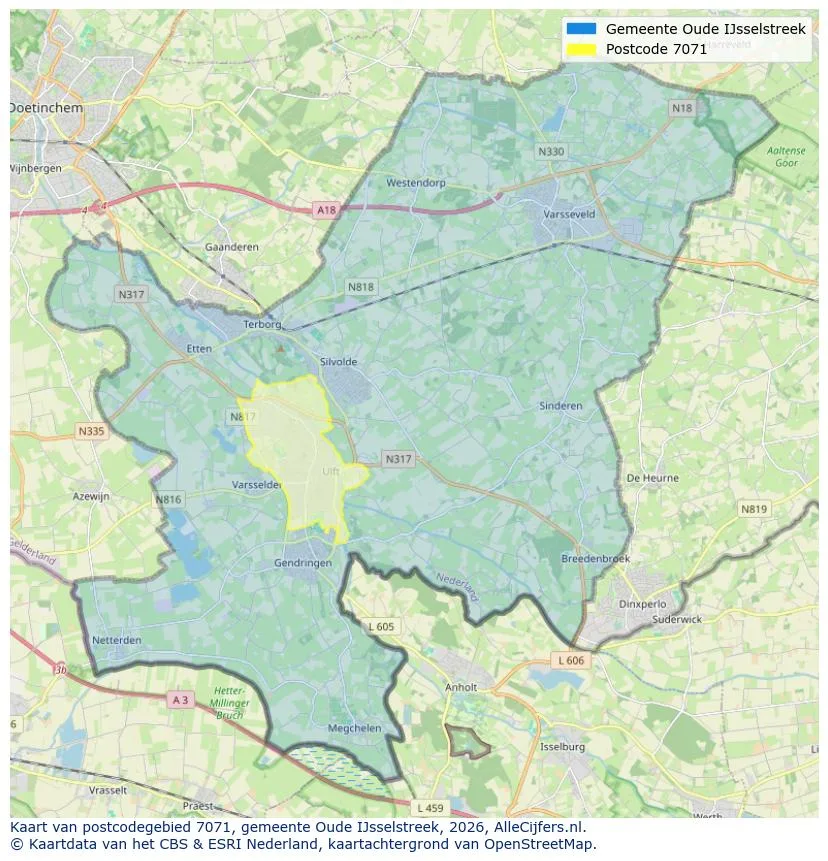
Spatial overview of the work area in Ulft
View current location data on residents, WOZ development, housing stock, energy consumption, business activity and safety in Ulft. In 2026 were there 10.541 residents. The average WOZ value in 2025 is EUR 310.425.
Residents
10.541
Last year: 2026
Average WOZ
EUR 310.425
Last year: 2025
Average income per person.
EUR 23.796
Source: AllNumbers
Crimes (current year)
211
Total registered
| Year | Residents |
|---|---|
| 2021 | 10.455 |
| 2022 | 10.440 |
| 2023 | 10.570 |
| 2024 | 10.510 |
| 2025 | 10.570 |
| 2026 | 10.541 |
| Year | Average WOZ |
|---|---|
| 2021 | EUR 215.873 |
| 2022 | EUR 244.593 |
| 2023 | EUR 280.229 |
| 2024 | EUR 297.087 |
| 2025 | EUR 310.425 |
Hoger
1.430
Praktisch
2.560
Middelbaar
3.750
Europa
820
Nederland
8.575
Buiten Europa
1.180
Label C
1.385
Label A
1.043
Label B
829
Label G
389
Label D
332
Label F
331
Label E
274
Label A+
143
Label A+++
113
Label A++
99
Label A++++
83
Label A+++++
0
| Year | Gas (m3) | Electricity (kWh) |
|---|---|---|
| 2020 | 1.201 | 2.880 |
| 2021 | 1.332 | 2.916 |
| 2022 | 1.045 | 2.737 |
| 2023 | 835 | 2.667 |
| 2024 | 819 | 2.729 |
Hoekwoning
Gas: 816 • Electricity: 2.597
Huurwoning
Gas: 656 • Electricity: 2.100
Koopwoning
Gas: 956 • Electricity: 3.023
Appartement
Gas: 668 • Electricity: 2.120
Tussenwoning
Gas: 698 • Electricity: 2.465
Vrijstaande woning
Gas: 1.243 • Electricity: 3.658
Twee-onder-één-kap woning
Gas: 913 • Electricity: 2.808
Total number of company establishments: 1.165
| Period | Crimes |
|---|---|
| jan 2026 | 14 |
| jul 2025 | 26 |
| jun 2025 | 29 |
| mei 2025 | 22 |
| mrt 2025 | 14 |
| mrt 2026 | 22 |
| nov 2024 | 19 |
| nov 2025 | 14 |
| okt 2024 | 17 |
| okt 2025 | 18 |
| sep 2024 | 17 |
| sep 2025 | 14 |
These figures give an indicative picture of safety trends in the living environment of Ulft.
Short answers based on current local statistics, handy for a quick comparison of the living environment.
Ulft telt in 2026 ongeveer 10.541 inwoners.
De gemiddelde WOZ-waarde in Ulft is in 2025 circa € 310.425.
Het gemiddelde inkomen per inwoner in Ulft ligt rond € 23.796 per jaar.
Voor het huidige jaar gaat het om ongeveer 211 geregistreerde misdrijven. Gebruik deze cijfers als indicatie en vergelijk trends per periode.
In Ulft komt vooral "Tussenwoningen" veel voor, met ongeveer 1.333 woningen.
View more homes in this location.

7071DA Ulft
€ 1.495.000 k.k.
€ 4.199/m²
7071BP Ulft
€ 385.000 k.k.
€ 2.984/m²
7071KL Ulft
€ 399.000 k.k.
€ 3.117/m²
7071AZ Ulft
€ 535.000 k.k.
€ 3.223/m²
7071VN Ulft
€ 299.000 k.k.
€ 3.560/m²

7071DD Ulft
€ 500.000 k.k.
€ 3.571/m²
7071HC Ulft
€ 239.000 k.k.
€ 3.025/m²
7071XP Ulft
€ 579.000 k.k.
€ 4.136/m²
