Residents
325.510
Last year: 2025
3526NL Utrecht • Utrecht
€ 546.000 v.o.n.
Cost of copper (estimated): € 12.770
2% transfer tax (€ 10.920) + notary (€ 1.150) + valuation (€ 700)
Total incl. VAT: € 558.770
Purchase price /m²: € 7.091
Het 3-kamerappartement aan De Polderwerker 165, Utrecht, biedt een zonnig balkon en ruimte in een moderne ontwerp omgeving. Met woonoppervlakten van ca. 68 tot 86 m², hoge deuren en verdiepingshoogtes van maximaal 3 meter op de begane grond, is dit appartement comfortabel en licht. De koopsom inclust keuken en sanitair. Het project Ludens Joy in Merwede vormt een sociaal ecosysteem met ruimte voor interactie en creativiteit midden in Utrecht, nabij groene open ruimtes en zonder autoverkeer.
€ 546.000
Cost of copper (estimated): € 12.770
2% transfer tax (€ 10.920) + notary (€ 1.150) + valuation (€ 700)
Total purchase (incl. p.p.): € 558.770
3,04%
Yearly
€ 27.300
Direct available
Estimated mortgage
Indicative gross monthly cost
Based on annuity and 30 year term
Indicative net monthly cost
iDisclaimer: this mortgage calculation is a simplified indication based on general assumptions. No rights can be derived from the results shown. Calculated with 10-annual interest (zonder NHG), automatically determined based on the price limit € 470.000. Source: 10-jaars rente uit mortgage_rates (23-04-2026 08:38). For non-NHG, an 80% mortgage of the market value has been used in this indication.
Douche, wastafel, en wastafelmeubel
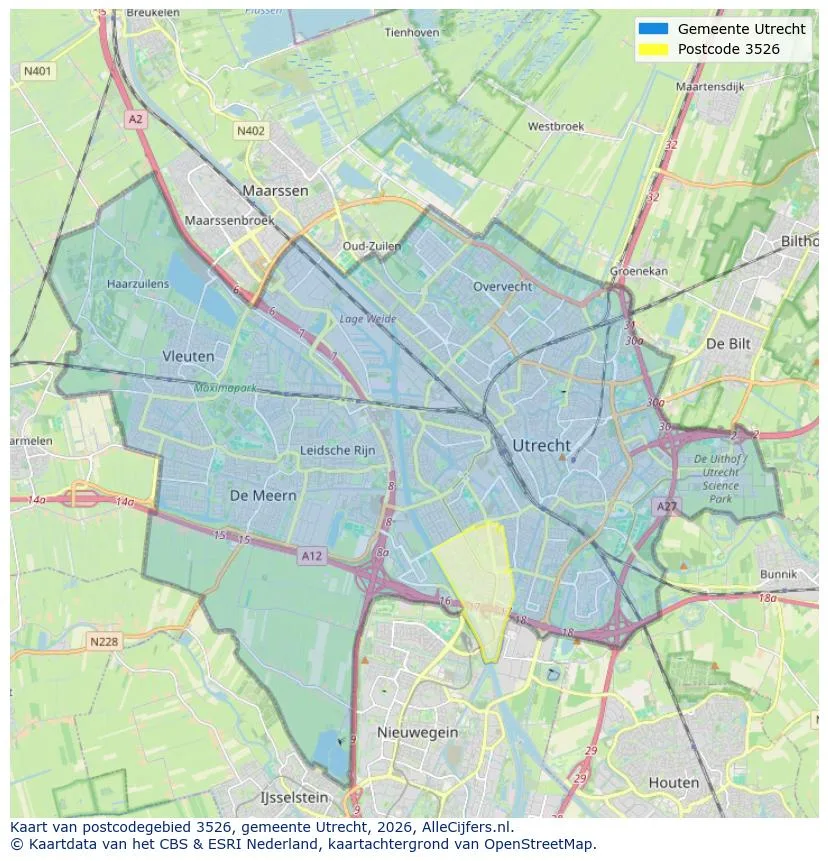
Explore Utrecht and the surrounding areas
View current location data on residents, WOZ development, housing stock, energy consumption, business activity and safety in Utrecht. In 2025 were there 325.510 residents. The average WOZ value in 2025 is EUR 474.416.
Residents
325.510
Last year: 2025
Average WOZ
EUR 474.416
Last year: 2025
Average income per person.
EUR 38.255
Source: AllNumbers
Crimes (current year)
25.985
Total registered
| Year | Residents |
|---|---|
| 2021 | 308.685 |
| 2022 | 310.610 |
| 2023 | 316.460 |
| 2024 | 323.020 |
| 2025 | 325.510 |
| Year | Average WOZ |
|---|---|
| 2021 | EUR 349.277 |
| 2022 | EUR 381.193 |
| 2023 | EUR 442.579 |
| 2024 | EUR 435.454 |
| 2025 | EUR 474.416 |
Hoger
148.860
Praktisch
45.840
Middelbaar
67.680
Europa
37.515
Nederland
186.915
Buiten Europa
101.045
Label A
47.799
Label C
25.699
Label B
17.523
Label D
13.066
Label F
12.655
Label G
11.728
Label E
11.306
Label A+
9.677
Label A++
5.013
Label A+++
4.232
Label A++++
725
Label A+++++
21
| Year | Gas (m3) | Electricity (kWh) |
|---|---|---|
| 2020 | 664 | 2.253 |
| 2021 | 740 | 2.328 |
| 2022 | 572 | 2.170 |
| 2023 | 484 | 2.028 |
| 2024 | 468 | 2.042 |
Hoekwoning
Gas: 791 • Electricity: 2.601
Huurwoning
Gas: 421 • Electricity: 1.821
Koopwoning
Gas: 587 • Electricity: 2.316
Appartement
Gas: 368 • Electricity: 1.760
Tussenwoning
Gas: 700 • Electricity: 2.361
Vrijstaande woning
Gas: 1.325 • Electricity: 3.953
Twee-onder-één-kap woning
Gas: 898 • Electricity: 3.142
Total number of company establishments: 55.750
| Period | Crimes |
|---|---|
| jan 2025 | 1.938 |
| jan 2026 | 2.042 |
| jul 2025 | 2.284 |
| jun 2025 | 2.296 |
| mei 2025 | 2.085 |
| mrt 2025 | 2.095 |
| nov 2024 | 2.183 |
| nov 2025 | 2.313 |
| okt 2024 | 2.124 |
| okt 2025 | 2.340 |
| sep 2024 | 1.881 |
| sep 2025 | 2.221 |
These figures give an indicative picture of safety trends in the living environment of Utrecht.
Short answers based on current local statistics, handy for a quick comparison of the living environment.
Utrecht telt in 2025 ongeveer 325.510 inwoners.
De gemiddelde WOZ-waarde in Utrecht is in 2025 circa € 474.416.
Het gemiddelde inkomen per inwoner in Utrecht ligt rond € 38.255 per jaar.
Voor het huidige jaar gaat het om ongeveer 25.985 geregistreerde misdrijven. Gebruik deze cijfers als indicatie en vergelijk trends per periode.
In Utrecht komt vooral "Appartementen" veel voor, met ongeveer 108.137 woningen.
View more homes in this location.

3531PD Utrecht
€ 385.000 k.k.
3553VH Utrecht
€ 484.500 k.k.
3544CE Utrecht
€ 495.000 k.k.
3552XJ Utrecht
€ 601 p/m
€ 13/m²
3571PJ Utrecht
€ 798.000 k.k.
3564CW Utrecht
€ 525.000 k.k.
3554HJ Utrecht
€ 474.500 k.k.
3514HR Utrecht
€ 400.000 k.k.
