
Residents
325.510
Last year: 2025
€ 450.000 k.k.
Cost of copper (estimated): € 10.850
2% transfer tax (€ 9.000) + notary (€ 1.150) + valuation (€ 700)
Total incl. VAT: € 460.850
Purchase price /m²: € 7.627
IT'S LIKE A DREAM BUT COULD BE YOURS. Een verborgen kans. In het uitademen van de stad. De Vlasstraat. Wonen in Wittevrouwen is al een droom, maar dit is 't moment dat je ‘m wakker kust. Alles binnen de straal van je voordeur. Niet opgepoetst maar opnieuw uitgevonden. WHAT WOULD YOUR CHAPTER LOOK LIKE? Wonen. Slapen. Dromen. Alles op één niveau. Geen centimeter verspild. Geen keuze gemist. Niet groter dan nodig. Maar groots in wat telt. Een patio waar je de vogels hoort fluiten terwijl de stad zwijgt. Een kelder die al je spullen slikt. Niets te verbouwen. Niet wachten. Leven. THIS LOCATION FEELS UNREAL, BUT IT’S NOT. VLASSTRAAT 2, 3572 TT UTRECHT Stad op je lip. Zonder ‘m te hoeven verdragen. Achter de reuring, net vóór het bekende. Nabij het Griftpark, midden in het gemak. Hartje centrum? Vijf minuten fietsen als je haast hebt. Tien als je een goed leven leidt. Nul reden om te gaan.
€ 450.000
Cost of copper (estimated): € 10.850
2% transfer tax (€ 9.000) + notary (€ 1.150) + valuation (€ 700)
Total purchase (incl. p.p.): € 460.850
2,78%
Yearly
€ 22.500
Direct available
Estimated mortgage
Indicative gross monthly cost
Based on annuity and 30 year term
Indicative net monthly cost
iDisclaimer: this mortgage calculation is a simplified indication based on general assumptions. No rights can be derived from the results shown. Calculated with 10-annual interest (met NHG), automatically determined based on the price limit € 470.000. Source: 10-jaars rente uit mortgage_rates (05-05-2026 03:45).
Douche en wastafel
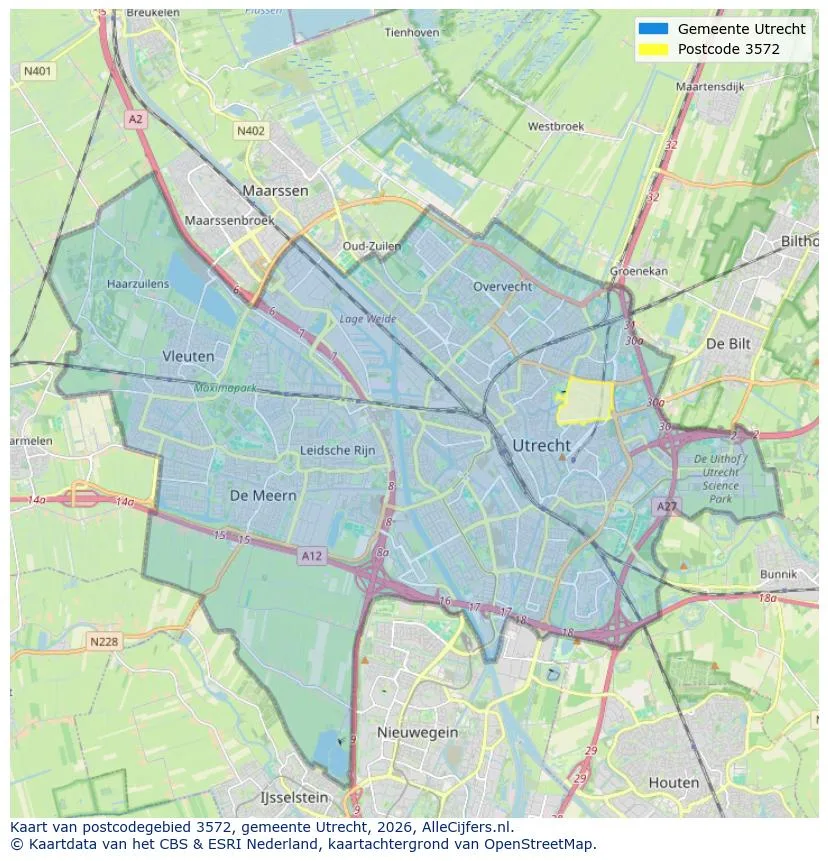
Explore Utrecht and the surrounding areas
View current location data on residents, WOZ development, housing stock, energy consumption, business activity and safety in Utrecht. In 2025 were there 325.510 residents. The average WOZ value in 2025 is EUR 474.416.
Residents
325.510
Last year: 2025
Average WOZ
EUR 474.416
Last year: 2025
Average income per person.
EUR 38.255
Source: AllNumbers
Crimes (current year)
25.985
Total registered
| Year | Residents |
|---|---|
| 2021 | 308.685 |
| 2022 | 310.610 |
| 2023 | 316.460 |
| 2024 | 323.020 |
| 2025 | 325.510 |
| Year | Average WOZ |
|---|---|
| 2021 | EUR 349.277 |
| 2022 | EUR 381.193 |
| 2023 | EUR 442.579 |
| 2024 | EUR 435.454 |
| 2025 | EUR 474.416 |
Hoger
148.860
Praktisch
45.840
Middelbaar
67.680
Europa
37.515
Nederland
186.915
Buiten Europa
101.045
Label A
47.799
Label C
25.699
Label B
17.523
Label D
13.066
Label F
12.655
Label G
11.728
Label E
11.306
Label A+
9.677
Label A++
5.013
Label A+++
4.232
Label A++++
725
Label A+++++
21
| Year | Gas (m3) | Electricity (kWh) |
|---|---|---|
| 2020 | 664 | 2.253 |
| 2021 | 740 | 2.328 |
| 2022 | 572 | 2.170 |
| 2023 | 484 | 2.028 |
| 2024 | 468 | 2.042 |
Hoekwoning
Gas: 791 • Electricity: 2.601
Huurwoning
Gas: 421 • Electricity: 1.821
Koopwoning
Gas: 587 • Electricity: 2.316
Appartement
Gas: 368 • Electricity: 1.760
Tussenwoning
Gas: 700 • Electricity: 2.361
Vrijstaande woning
Gas: 1.325 • Electricity: 3.953
Twee-onder-één-kap woning
Gas: 898 • Electricity: 3.142
Total number of company establishments: 55.750
| Period | Crimes |
|---|---|
| jan 2025 | 1.938 |
| jan 2026 | 2.042 |
| jul 2025 | 2.284 |
| jun 2025 | 2.296 |
| mei 2025 | 2.085 |
| mrt 2025 | 2.095 |
| nov 2024 | 2.183 |
| nov 2025 | 2.313 |
| okt 2024 | 2.124 |
| okt 2025 | 2.340 |
| sep 2024 | 1.881 |
| sep 2025 | 2.221 |
These figures give an indicative picture of safety trends in the living environment of Utrecht.
Short answers based on current local statistics, handy for a quick comparison of the living environment.
Utrecht telt in 2025 ongeveer 325.510 inwoners.
De gemiddelde WOZ-waarde in Utrecht is in 2025 circa € 474.416.
Het gemiddelde inkomen per inwoner in Utrecht ligt rond € 38.255 per jaar.
Voor het huidige jaar gaat het om ongeveer 25.985 geregistreerde misdrijven. Gebruik deze cijfers als indicatie en vergelijk trends per periode.
In Utrecht komt vooral "Appartementen" veel voor, met ongeveer 108.137 woningen.
View more homes in this location.

3521CH Utrecht
€ 1.950 p/m
€ 35/m²

3572SG Utrecht
€ 1.895 p/m
€ 25/m²

3513AL Utrecht
€ 379.000 k.k.

3521CT Utrecht
€ 749.000 k.k.

3532TP Utrecht
€ 699.000 k.k.
3522EL Utrecht
€ 725.000 k.k.

3531SC Utrecht
€ 450.000 k.k.

3541HG Utrecht
€ 450.000 k.k.
