- Sold
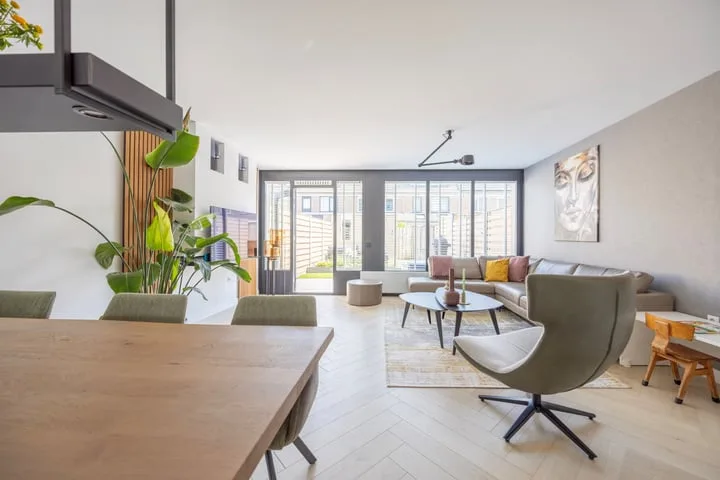
Kleine Boterbloem 11
1991KM Velserbroek
€ 549.000 k.k.
€ 5.036/m²
- Living area
- 109 m²
- Land area
- 137 m²
- Bedrooms
- 4
View 106 sold houses in Velserbroek
Type to search. Use arrow down and arrow up to navigate through results and press Enter to open.
Hidden search suggestions.
Compare sold homes in Velserbroek or view the current offering in this location directly.
On this page you will find recently sold homes in Velserbroek. Use this overview to better estimate selling prices, popular neighborhoods, and the local housing supply before you choose a real estate agent. Also view the current housing supply with 127 houses in Velserbroek.
1991KM Velserbroek
€ 549.000 k.k.
€ 5.036/m²
1991PM Velserbroek
€ 425.000 k.k.
€ 4.885/m²
1991VE Velserbroek
€ 545.000 k.k.
€ 4.579/m²
1991BR Velserbroek
€ 599.000 k.k.
€ 4.869/m²
1991RB Velserbroek
€ 450.000 k.k.
€ 6.250/m²
1991KA Velserbroek
€ 485.000 k.k.
€ 5.271/m²
1991LN Velserbroek
€ 498.000 k.k.
€ 4.654/m²
1992HJ Velserbroek
€ 649.000 k.k.
€ 5.031/m²
1992AX Velserbroek
€ 695.000 k.k.
€ 4.664/m²
1991HA Velserbroek
€ 540.000 k.k.
€ 4.500/m²
1991SX Velserbroek
€ 675.000 k.k.
€ 4.411/m²
1991HK Velserbroek
€ 550.000 k.k.
€ 5.045/m²
1991XC Velserbroek
€ 835.000 k.k.
€ 4.691/m²
1992CB Velserbroek
€ 825.000 k.k.
€ 6.445/m²
1991BW Velserbroek
€ 535.000 k.k.
€ 4.385/m²
1991PS Velserbroek
€ 425.000 k.k.
€ 4.941/m²
1991XR Velserbroek
€ 719.000 k.k.
€ 5.172/m²
1991TD Velserbroek
€ 500.000 k.k.
€ 4.201/m²
1991LZ Velserbroek
€ 598.000 k.k.
€ 4.635/m²
1991ER Velserbroek
€ 550.000 k.k.
€ 4.435/m²
1991KE Velserbroek
€ 519.000 k.k.
€ 4.592/m²
1991TG Velserbroek
€ 498.000 k.k.
€ 5.134/m²
Get free quotes from realtors with local market knowledge in Velserbroek.
Selling a home in Velserbroek? Compare real estate agents who know the local housing market. Also check out all real estate agents in Velserbroek or the top 10 real estate agents in Velserbroek for extra context for your choice.
By comparing brokers and requesting quotes
Short answers about housing prices, sold homes and comparing real estate agents in Velserbroek.
The costs of a real estate agent in Velserbroek vary per office, property type and sales approach. Therefore, compare multiple quotes and also look at the real estate agents in Velserbroek to better compare rates, presentation and local experience.
On this page we currently show 106 sold houses in Velserbroek from our selection. This helps you to better assess recent transactions and the local housing market.
Houses sold in Velserbroek give insight into asking prices, house types and neighborhoods where recent transactions have taken place. Compare this also with the current housing stock in Velserbroek to better understand the market.
You can use sold homes as a first market indication, but a local real estate agent can better take into account finishing, location, maintenance and current demand in Velserbroek.
Compare realtors in Velserbroek on local sales experience, reviews, expected yield, commission and marketing approach. The top 10 realtors in Velserbroek helps to quickly discover strong offices.
View current location data on residents, WOZ development, housing stock, energy consumption, business activity and safety in Velserbroek. In 2025 were there 15.420 residents. The average WOZ value in 2025 is EUR 482.000.
These figures help to better assess and compare the housing stock in Velserbroek with recent sold homes. Orient yourself then on suitable top real estate agents in Velserbroek for sales advice in this region.
Residents
15.420
Last year: 2025
Average WOZ
EUR 482.000
Last year: 2025
Average income per person.
EUR 36.900
Source: AllNumbers
Crimes (current year)
298
Total registered
| Year | Residents |
|---|---|
| 2021 | 15.190 |
| 2022 | 14.970 |
| 2023 | 14.935 |
| 2024 | 15.085 |
| 2025 | 15.420 |
| Year | Average WOZ |
|---|---|
| 2021 | EUR 358.000 |
| 2022 | EUR 406.000 |
| 2023 | EUR 459.000 |
| 2024 | EUR 464.000 |
| 2025 | EUR 482.000 |
Hoger
4.060
Praktisch
2.360
Middelbaar
5.370
Europa
875
Nederland
12.945
Buiten Europa
1.605
Label C
2.452
Label B
2.242
Label A
1.216
Label A+++
396
Label A++
93
Label A+
72
Label D
24
Label G
10
Label F
9
Label E
6
Label A++++
3
Label A+++++
0
| Year | Gas (m3) | Electricity (kWh) |
|---|---|---|
| 2020 | 930 | 3.010 |
| 2021 | 1.060 | 2.990 |
| 2022 | 830 | 2.740 |
| 2023 | 720 | 2.510 |
| 2024 | 700 | 2.530 |
Hoekwoning
Gas: 830 • Electricity: 2.740
Huurwoning
Gas: 620 • Electricity: 2.040
Koopwoning
Gas: 770 • Electricity: 2.720
Appartement
Gas: 570 • Electricity: 1.830
Tussenwoning
Gas: 720 • Electricity: 2.630
Vrijstaande woning
Gas: 1.540 • Electricity: 4.120
Twee-onder-één-kap woning
Gas: 1.100 • Electricity: 3.360
Total number of company establishments: 1.605
| Period | Crimes |
|---|---|
| jan 2025 | 21 |
| jan 2026 | 14 |
| jul 2025 | 27 |
| jun 2025 | 30 |
| mei 2025 | 29 |
| mrt 2025 | 32 |
| nov 2024 | 12 |
| nov 2025 | 17 |
| okt 2024 | 18 |
| okt 2025 | 21 |
| sep 2024 | 24 |
| sep 2025 | 29 |
These figures give an indicative picture of safety trends in the living environment of Velserbroek.
Short answers based on current local statistics, handy for a quick comparison of the living environment.
Velserbroek telt in 2025 ongeveer 15.420 inwoners.
De gemiddelde WOZ-waarde in Velserbroek is in 2025 circa € 482.000.
Het gemiddelde inkomen per inwoner in Velserbroek ligt rond € 36.900 per jaar.
Voor het huidige jaar gaat het om ongeveer 298 geregistreerde misdrijven. Gebruik deze cijfers als indicatie en vergelijk trends per periode.
In Velserbroek komt vooral "Tussenwoningen" veel voor, met ongeveer 3.704 woningen.