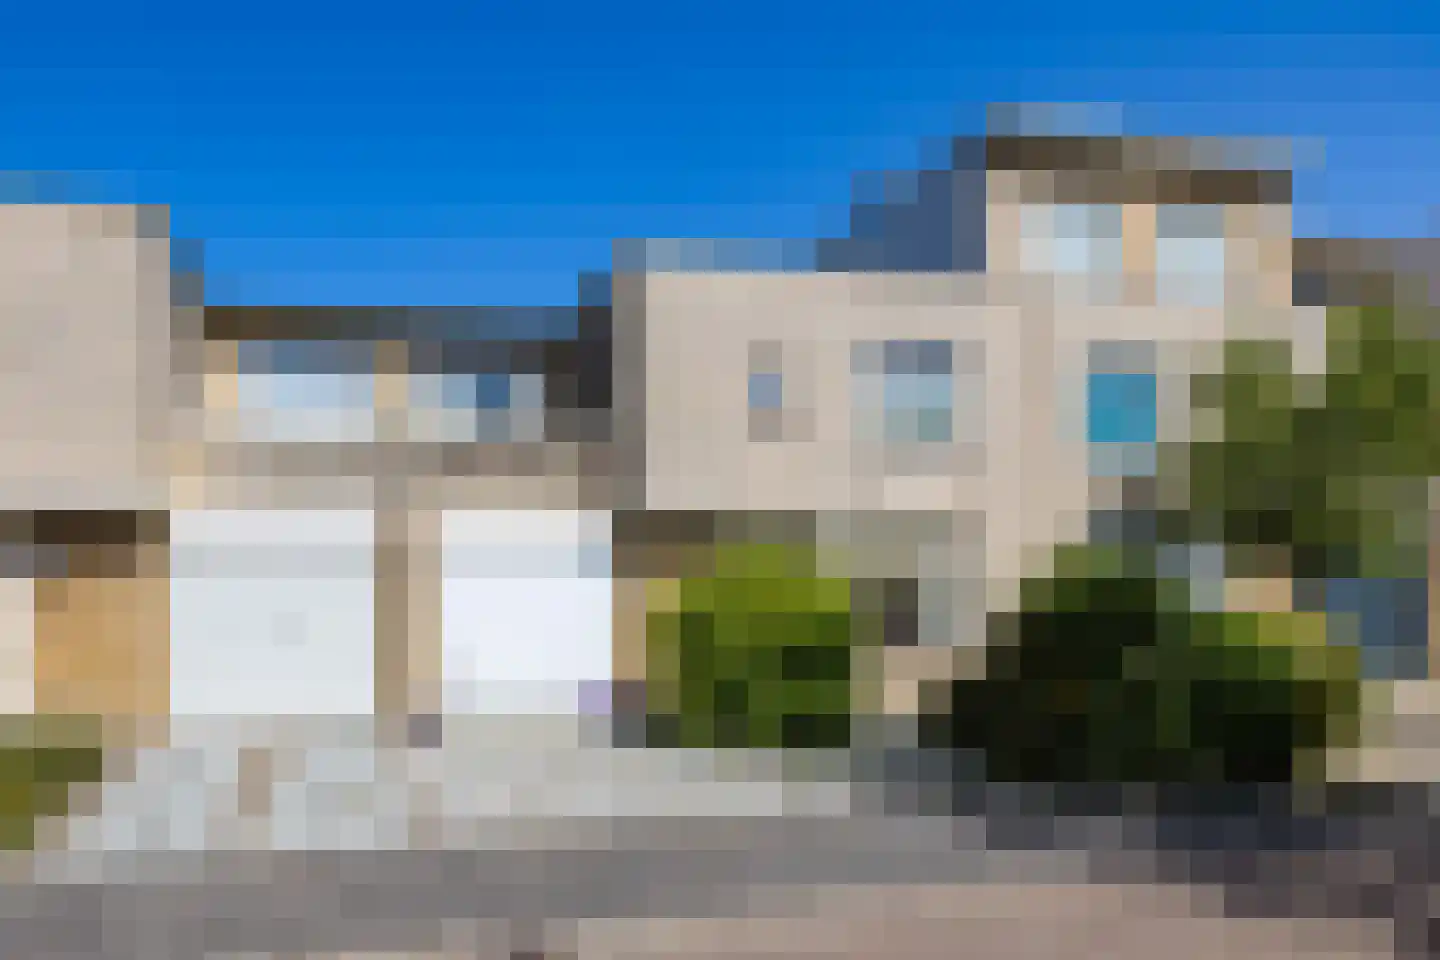
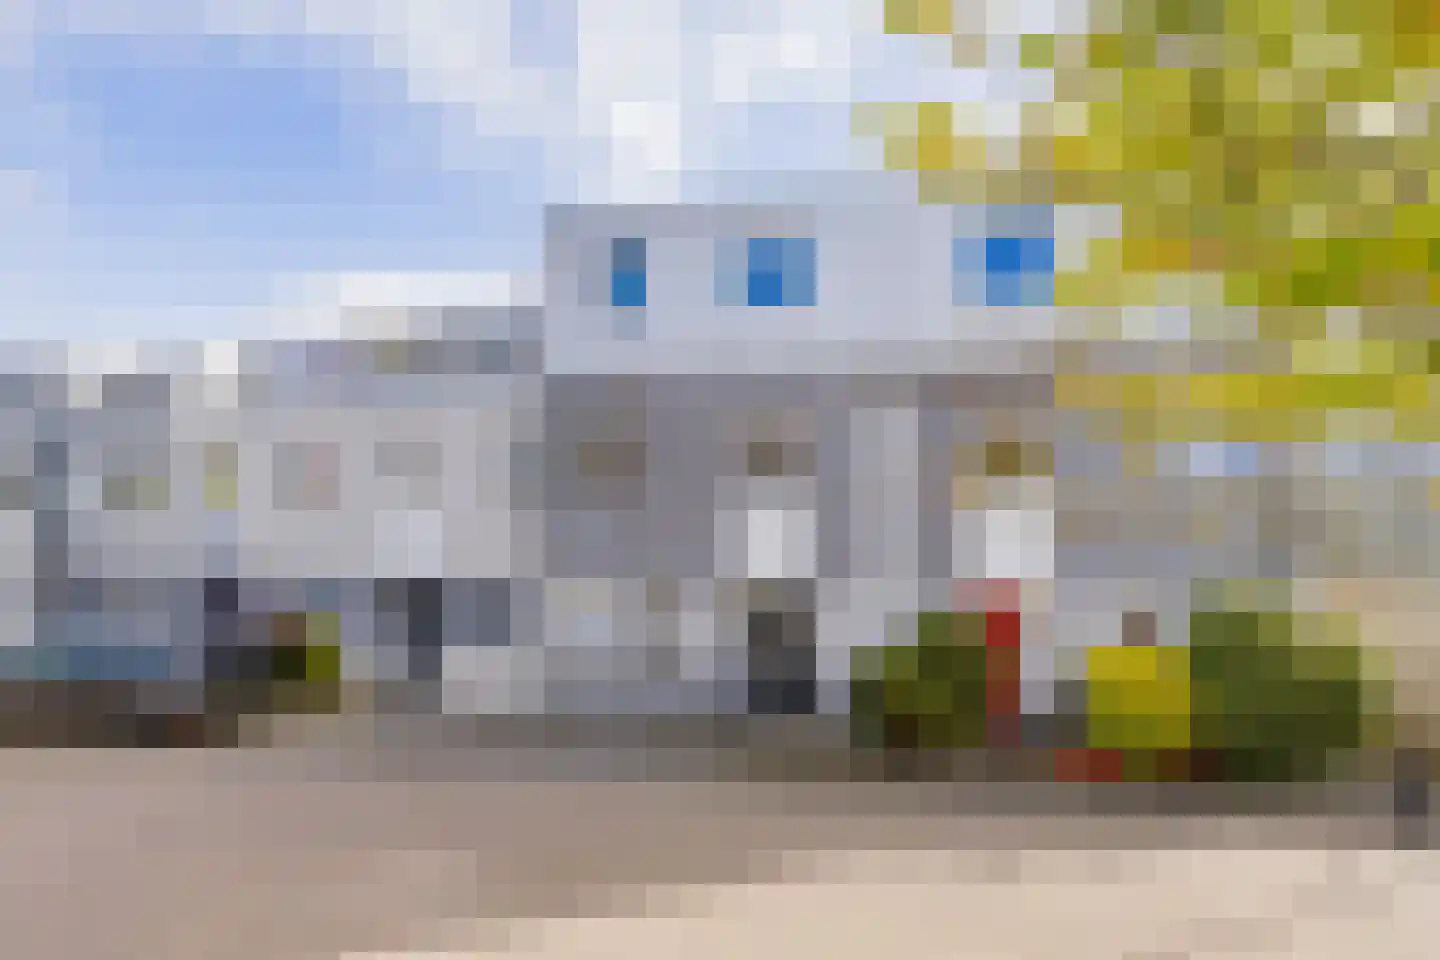
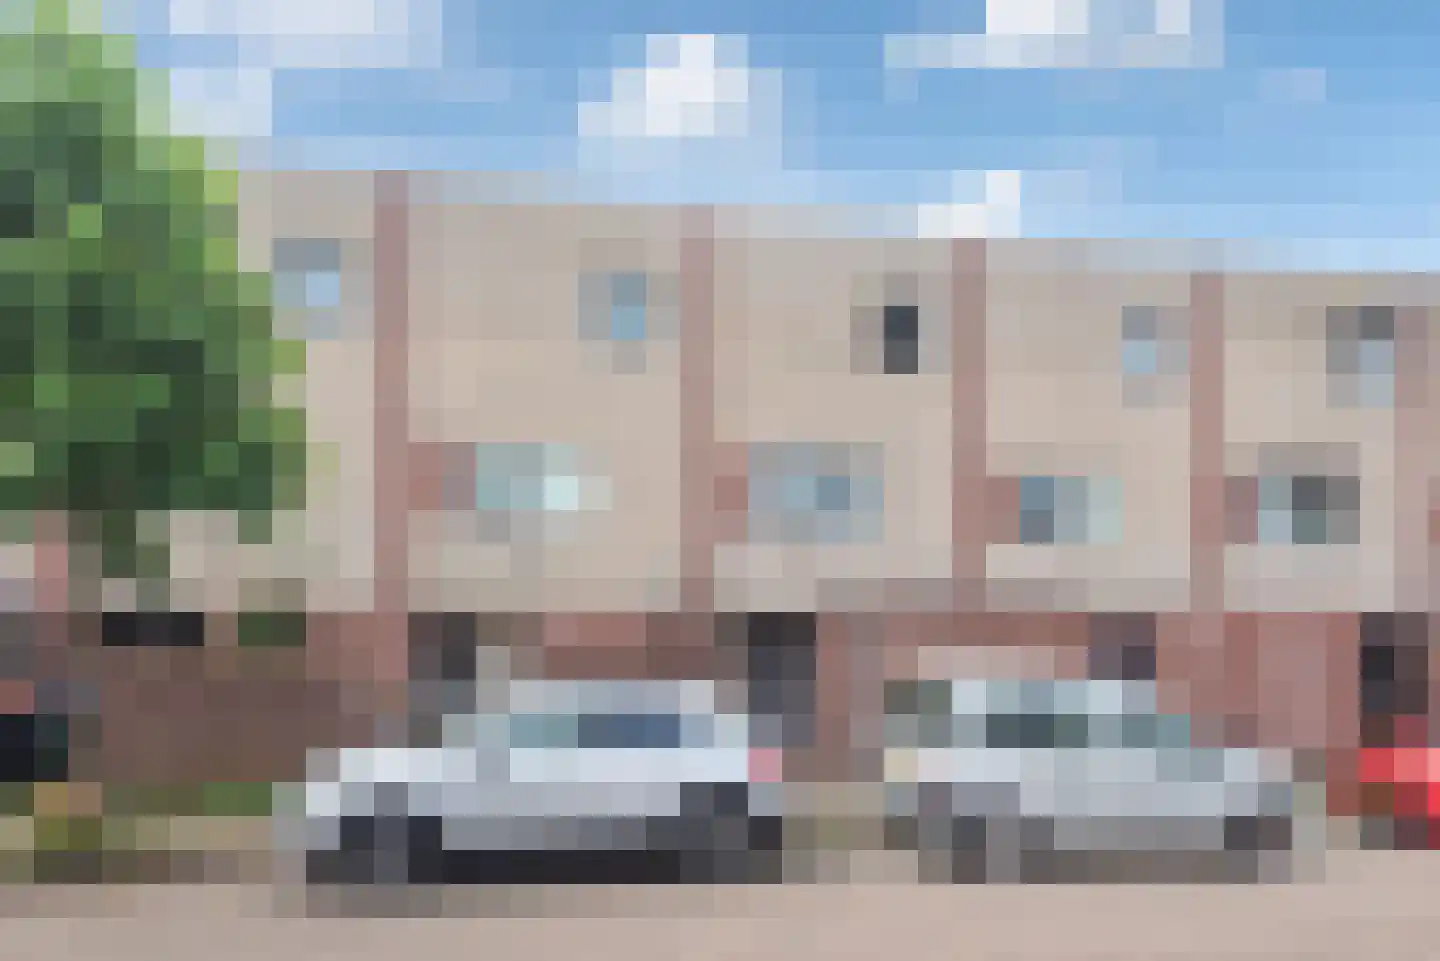
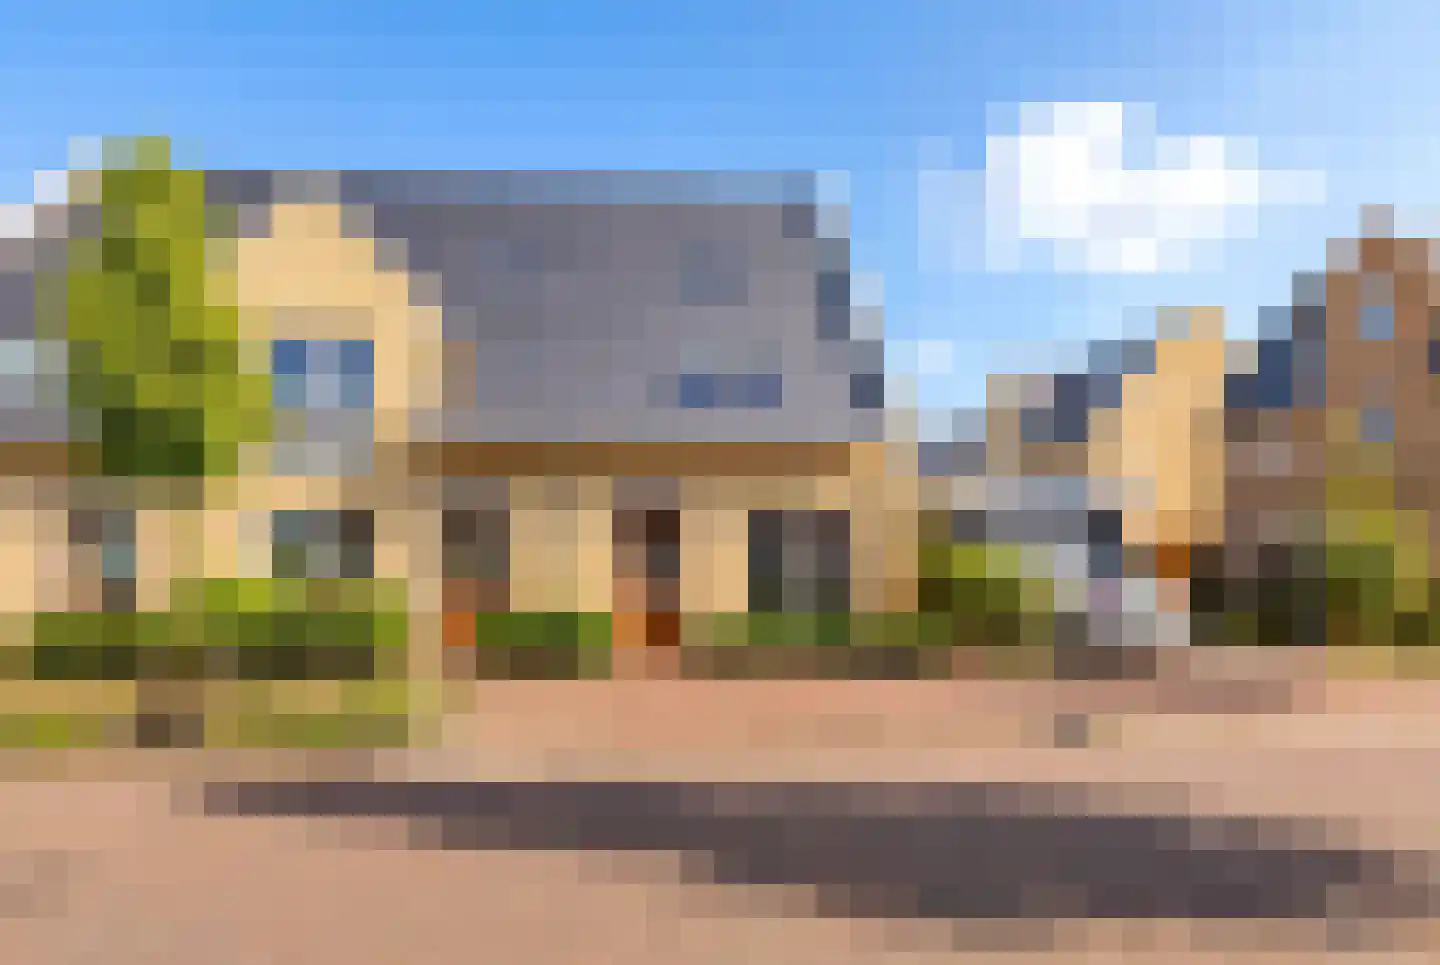
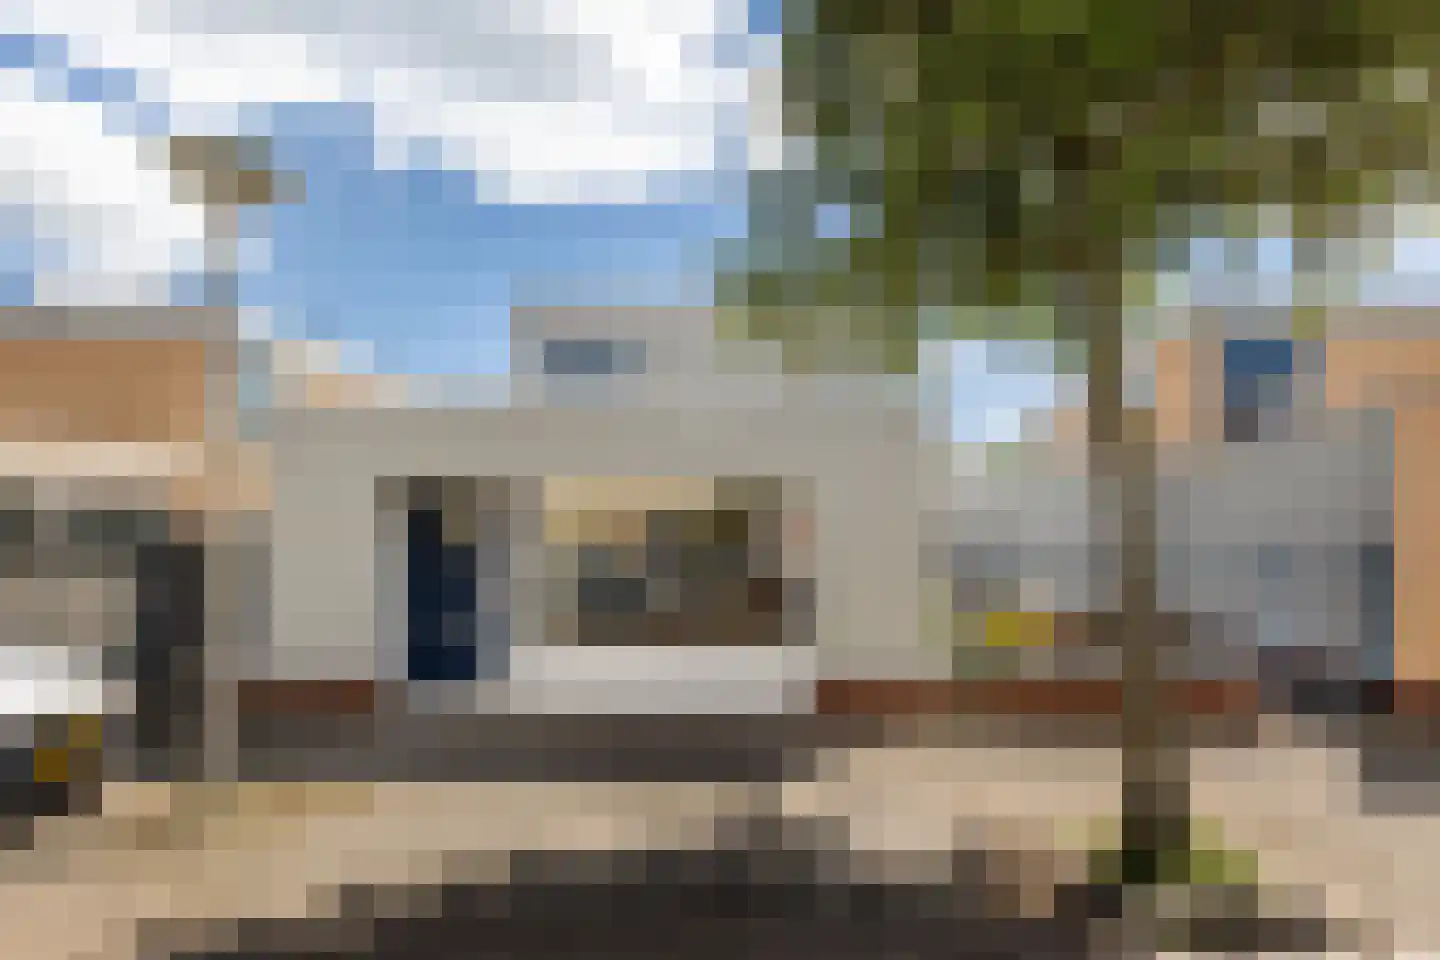
- Available
Schoener 69
1991XB Velserbroek
€ 849.000 k.k.
€ 5.084/m²
- Living area
- 167 m²
- Land area
- 257 m²
- Bedrooms
- 4
Searching in 136 houses in Velserbroek
Type to search. Use arrow down and arrow up to navigate through results and press Enter to open.
Hidden search suggestions.
View current properties in Velserbroek or search targeted on street, postal code and property characteristics.
View the current housing stock in Velserbroek and quickly filter by price, living area, rooms and more. There are currently 136 houses in this place within our selection. View also 105 sold houses in Velserbroek for extra insight into the local housing market.
1991XB Velserbroek
€ 849.000 k.k.
€ 5.084/m²
1992JG Velserbroek
€ 439.000 k.k.
€ 6.014/m²
1992BK Velserbroek
€ 510.000 k.k.
€ 5.312/m²
1991PD Velserbroek
€ 585.000 k.k.
€ 5.850/m²
1991GC Velserbroek
€ 535.000 k.k.
€ 5.000/m²
1991GM Velserbroek
€ 519.000 k.k.
€ 4.398/m²
1991XD Velserbroek
€ 535.000 k.k.
€ 4.315/m²
1991EM Velserbroek
€ 549.000 k.k.
€ 5.279/m²
1991LZ Velserbroek
€ 625.000 k.k.
€ 4.883/m²
1991HG Velserbroek
€ 565.000 k.k.
€ 5.231/m²
1991ZC Velserbroek
€ 865.000 k.k.
€ 5.925/m²
1991HV Velserbroek
€ 765.000 k.k.
€ 6.024/m²
1991TK Velserbroek
€ 565.000 k.k.
€ 4.631/m²
1991ND Velserbroek
€ 600.000 k.k.
€ 3.846/m²
1991RZ Velserbroek
€ 535.000 k.k.
€ 4.350/m²
1991GC Velserbroek
€ 570.000 k.k.
€ 5.327/m²
1991TK Velserbroek
€ 520.000 k.k.
€ 5.652/m²
1991DA Velserbroek
€ 595.000 k.k.
€ 4.508/m²
1991TC Velserbroek
€ 525.000 k.k.
1992CD Velserbroek
€ 975.000 k.k.
€ 5.838/m²
1992CD Velserbroek
€ 695.000 k.k.
€ 5.991/m²
1992AX Velserbroek
€ 529.000 k.k.
€ 6.011/m²
1992CC Velserbroek
€ 1.100.000 k.k.
€ 5.238/m²
1991XP Velserbroek
€ 395.000 k.k.
€ 5.338/m²
1991NV Velserbroek
€ 550.000 k.k.
€ 5.288/m²
1991XV Velserbroek
€ 575.000 k.k.
€ 4.957/m²
1991CD Velserbroek
€ 550.000 k.k.
€ 5.140/m²
1991TH Velserbroek
€ 500.000 k.k.
Get free quotes from real estate agents with local market knowledge. Compare more than 169 real estate agents in Velserbroek.
Selling a home in Velserbroek? Compare all real estate agents in Velserbroek or view the top 10 real estate agents in Velserbroek for extra context for your choice.
Real estate agents make sharper offers when they know you're comparing — ask for quotes for sale or purchase.
Practical answers about housing supply, sales and comparing real estate agents in Velserbroek.
The costs of a real estate agent in Velserbroek depend on commission, setup costs, property presentation and the chosen service. Compare the 169 real estate agents in Velserbroek via the real estate agent page and request multiple quotes to compare rates and approach well.
Within our selection, we are currently showing 136 houses in Velserbroek. View also the sold houses in Velserbroek to compare the current offering with recent transactions.
Take into account not only price and living area but also maintenance, energy label, location, outdoor space and sales status. This way you compare houses in Velserbroek on more than just the asking price.
A local real estate agent knows the neighborhoods, recent transactions and demand in Velserbroek. By comparing 169 real estate agents in the region you get a better insight into prices, sales strategy and expected yield; the top 10 in Velserbroek provides a useful starting point.
Yes, when making a sales plan, a valuation in Velserbroek is wise. You gain insight into a realistic asking price and can then compare offers from real estate agents specifically.
View current location data on residents, WOZ development, housing stock, energy consumption, business activity and safety in Velserbroek. In 2025 were there 15.420 residents. The average WOZ value in 2025 is EUR 482.000.
These figures help to better assess and compare the housing stock in Velserbroek with recent sold homes. Orient yourself then on suitable top real estate agents in Velserbroek for sales advice in this region.
Residents
15.420
Last year: 2025
Average WOZ
EUR 482.000
Last year: 2025
Average income per person.
EUR 36.900
Source: AllNumbers
Crimes (current year)
298
Total registered
| Year | Residents |
|---|---|
| 2021 | 15.190 |
| 2022 | 14.970 |
| 2023 | 14.935 |
| 2024 | 15.085 |
| 2025 | 15.420 |
| Year | Average WOZ |
|---|---|
| 2021 | EUR 358.000 |
| 2022 | EUR 406.000 |
| 2023 | EUR 459.000 |
| 2024 | EUR 464.000 |
| 2025 | EUR 482.000 |
Hoger
4.060
Praktisch
2.360
Middelbaar
5.370
Europa
875
Nederland
12.945
Buiten Europa
1.605
Label C
2.452
Label B
2.242
Label A
1.216
Label A+++
396
Label A++
93
Label A+
72
Label D
24
Label G
10
Label F
9
Label E
6
Label A++++
3
Label A+++++
0
| Year | Gas (m3) | Electricity (kWh) |
|---|---|---|
| 2020 | 930 | 3.010 |
| 2021 | 1.060 | 2.990 |
| 2022 | 830 | 2.740 |
| 2023 | 720 | 2.510 |
| 2024 | 700 | 2.530 |
Hoekwoning
Gas: 830 • Electricity: 2.740
Huurwoning
Gas: 620 • Electricity: 2.040
Koopwoning
Gas: 770 • Electricity: 2.720
Appartement
Gas: 570 • Electricity: 1.830
Tussenwoning
Gas: 720 • Electricity: 2.630
Vrijstaande woning
Gas: 1.540 • Electricity: 4.120
Twee-onder-één-kap woning
Gas: 1.100 • Electricity: 3.360
Total number of company establishments: 1.605
| Period | Crimes |
|---|---|
| jan 2025 | 21 |
| jan 2026 | 14 |
| jul 2025 | 27 |
| jun 2025 | 30 |
| mei 2025 | 29 |
| mrt 2025 | 32 |
| nov 2024 | 12 |
| nov 2025 | 17 |
| okt 2024 | 18 |
| okt 2025 | 21 |
| sep 2024 | 24 |
| sep 2025 | 29 |
These figures give an indicative picture of safety trends in the living environment of Velserbroek.
Short answers based on current local statistics, handy for a quick comparison of the living environment.
Velserbroek telt in 2025 ongeveer 15.420 inwoners.
De gemiddelde WOZ-waarde in Velserbroek is in 2025 circa € 482.000.
Het gemiddelde inkomen per inwoner in Velserbroek ligt rond € 36.900 per jaar.
Voor het huidige jaar gaat het om ongeveer 298 geregistreerde misdrijven. Gebruik deze cijfers als indicatie en vergelijk trends per periode.
In Velserbroek komt vooral "Tussenwoningen" veel voor, met ongeveer 3.704 woningen.