Residents
4.285
Last year: 2025
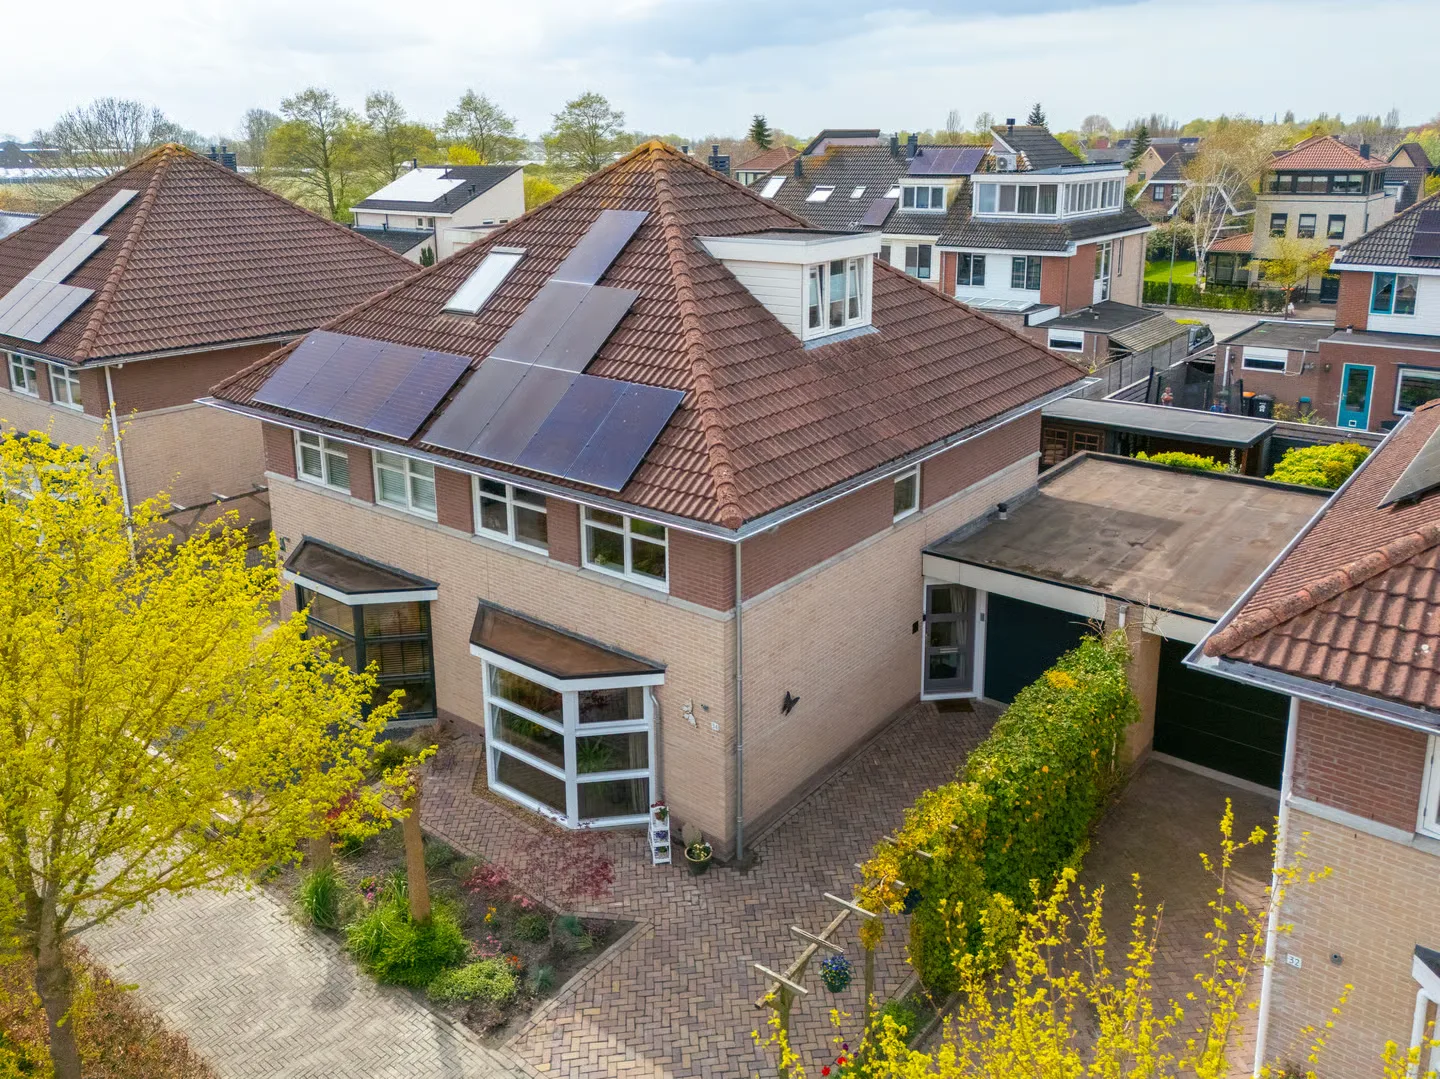
1606CM Venhuizen • Noord-Holland

For this property, no detailed description is available yet.
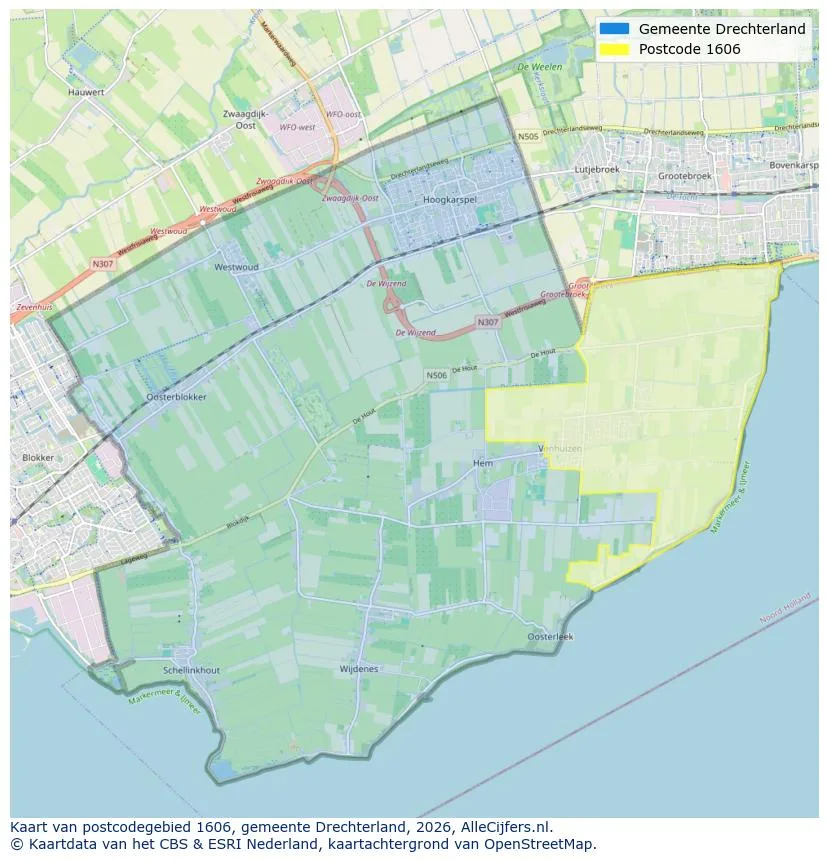
Discover where agents are active in Venhuizen
View current location data on residents, WOZ development, housing stock, energy consumption, business activity and safety in Venhuizen. In 2025 were there 4.285 residents. The average WOZ value in 2025 is EUR 396.000.
Residents
4.285
Last year: 2025
Average WOZ
EUR 396.000
Last year: 2025
Average income per person.
EUR 33.500
Source: AllNumbers
Crimes (current year)
68
Total registered
| Year | Residents |
|---|---|
| 2021 | 4.335 |
| 2022 | 4.325 |
| 2023 | 4.335 |
| 2024 | 4.300 |
| 2025 | 4.285 |
| Year | Average WOZ |
|---|---|
| 2021 | EUR 290.000 |
| 2022 | EUR 317.000 |
| 2023 | EUR 374.000 |
| 2024 | EUR 386.000 |
| 2025 | EUR 396.000 |
Hoger
740
Praktisch
850
Middelbaar
1.550
Europa
320
Nederland
3.705
Buiten Europa
260
Label A
560
Label B
428
Label C
409
Label G
177
Label D
167
Label F
82
Label A++
37
Label A+++
33
Label A+
32
Label E
23
Label A++++
10
Label A+++++
0
| Year | Gas (m3) | Electricity (kWh) |
|---|---|---|
| 2020 | 1.390 | 3.100 |
| 2021 | 1.490 | 3.120 |
| 2022 | 1.150 | 2.900 |
| 2023 | 960 | 2.770 |
| 2024 | 930 | 2.860 |
Hoekwoning
Gas: 860 • Electricity: 2.620
Huurwoning
Gas: 760 • Electricity: 1.980
Koopwoning
Gas: 1.040 • Electricity: 3.090
Appartement
Gas: 650 • Electricity: 1.540
Tussenwoning
Gas: 790 • Electricity: 2.400
Vrijstaande woning
Gas: 1.210 • Electricity: 3.500
Twee-onder-één-kap woning
Gas: 1.030 • Electricity: 2.890
Total number of company establishments: 590
| Period | Crimes |
|---|---|
| jan 2025 | 3 |
| jan 2026 | 6 |
| jul 2025 | 3 |
| jun 2025 | 12 |
| mei 2025 | 7 |
| mrt 2025 | 5 |
| nov 2024 | 4 |
| nov 2025 | 3 |
| okt 2024 | 5 |
| okt 2025 | 4 |
| sep 2024 | 0 |
| sep 2025 | 8 |
These figures give an indicative picture of safety trends in the living environment of Venhuizen.
Short answers based on current local statistics, handy for a quick comparison of the living environment.
Venhuizen telt in 2025 ongeveer 4.285 inwoners.
De gemiddelde WOZ-waarde in Venhuizen is in 2025 circa € 396.000.
Het gemiddelde inkomen per inwoner in Venhuizen ligt rond € 33.500 per jaar.
Voor het huidige jaar gaat het om ongeveer 68 geregistreerde misdrijven. Gebruik deze cijfers als indicatie en vergelijk trends per periode.
In Venhuizen komt vooral "Vrijstaande woningen" veel voor, met ongeveer 678 woningen.
View more homes in this location.

1606CX Venhuizen
€ 295.000 k.k.
€ 6.020/m²

1606AE Venhuizen
€ 550.000 k.k.
€ 4.044/m²

1606CC Venhuizen
€ 375.000 k.k.
€ 3.000/m²

1606CE Venhuizen
€ 649.000 k.k.
€ 3.434/m²
1606NN Venhuizen
€ 500.000 k.k.

1606BS Venhuizen
€ 450.000 k.k.

1606NG Venhuizen
€ 700.000 k.k.
€ 4.516/m²

1606BC Venhuizen
€ 550.000 k.k.
€ 2.736/m²
