Residents
43.030
Last year: 2025
2274XV Voorburg • Zuid-Holland
€ 400.000 k.k.
Cost of copper (estimated): € 9.850
2% transfer tax (€ 8.000) + notary (€ 1.150) + valuation (€ 700)
Total incl. VAT: € 409.850
Purchase price /m²: € 5.479
Open house
Maandag 15-06 van 16:30 tot 17:30
Open house
Maandag 15-06 van 16:30 tot 17:30
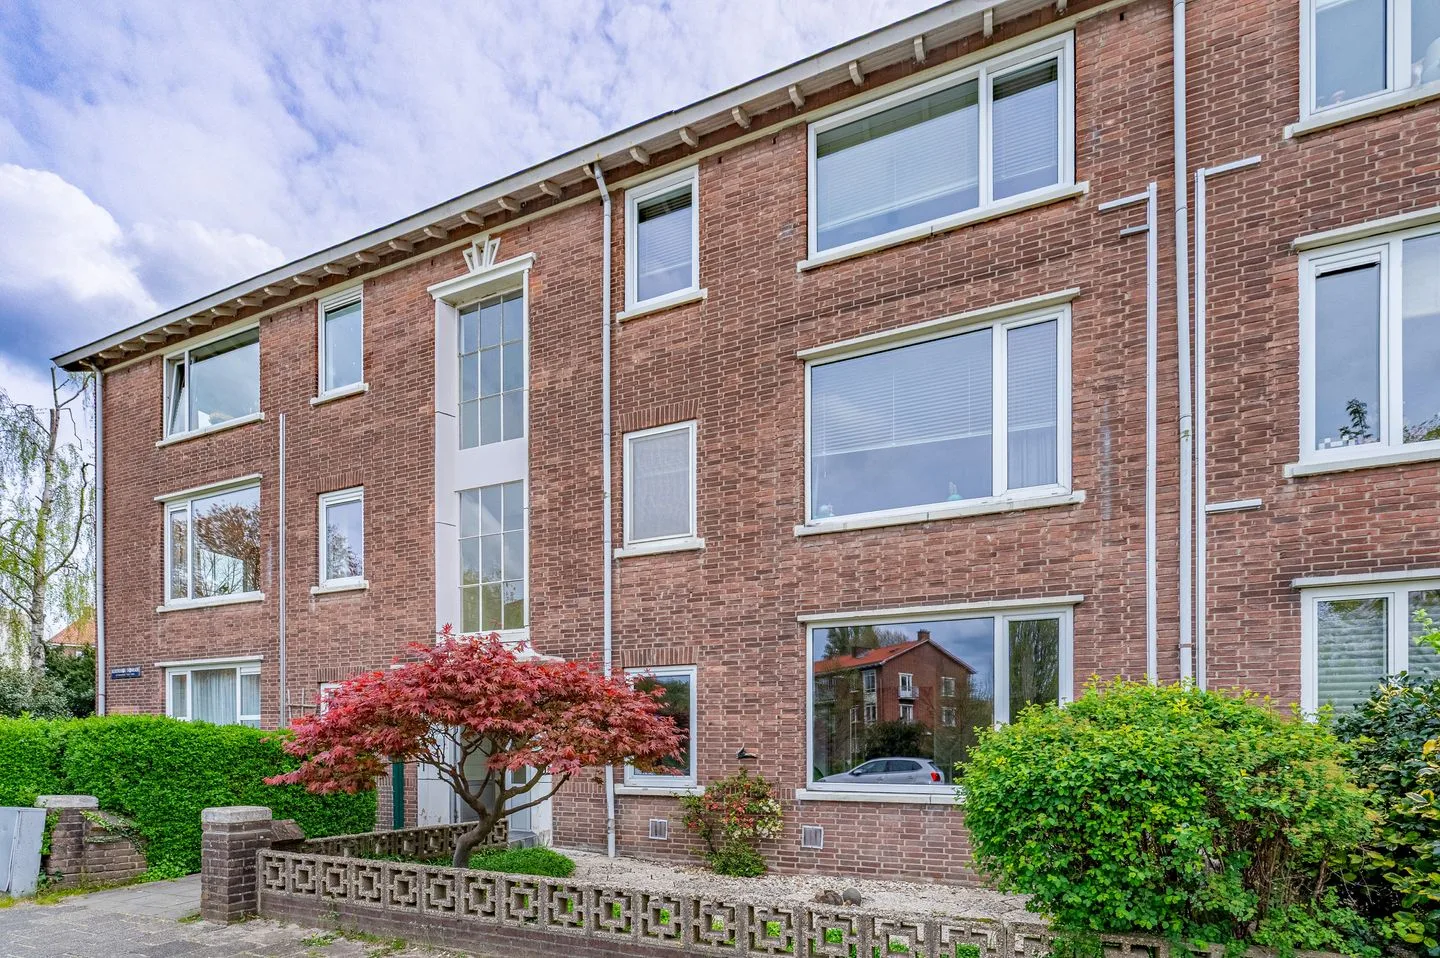
Op mooie locatie gelegen 3 kamer appartement met ruime tuin en fietsenberging, dat zowel de mogelijkheid biedt van comfort als gemak in een rustige, groene omgeving. Belangrijkste nieuws Neem contact op met onze SMASH Makelaar, Sander van Meerten voor een bezichtigingen van dit leuke appartement met veel mogelijkheden én een hele fijne voor en achter tuin. Het appartement is bijzonder licht en moet volledig gemoderniseerd worden, gelegen op de begane grond met ruime tuin en 2 slaapkamers en een eigen berging op de begane grond. Dit appartement ligt aan een rustige woonstraat met ruime parkeergelegenheid voor bewoners en bezoek. Maar het allermooiste is het vrije uitzicht over groen en een waterpartij. Op steenworp afstand ligt het winkelcentrum ‘De Julianabaan’, met een grote diversiteit aan winkels en gezelligheid. Ook het oude centrum van Voorburg met de gezellige Herenstraat ligt hier niet ver vandaan. Het vernieuwde winkelcentrum “The Mall of the Netherlands” en het centrum van Den Haag zijn ook snel en goed bereikbaar. Scheveningen en Delft liggen tevens binnen fietsbereik. De woning is zeer gunstig gelegen t.o.v. diverse uitvalswegen (Prins Clausplein, A12 en A4) en openbaar vervoer (Station Den Haag Laan van NOI en Station Voorburg, alsmede diverse bus-, tram- en Randstad railverbindingen nabij) en diverse groenvoorzieningen. Kortom; ideale ligging met voor ieder wat wils! Indeling: Dit appartement is bereikbaar via een privé afgesloten entree en een gesloten portiek naar de voordeur. De ruime hal biedt veel mogelijkheden waar tevens het toilet is gesitueerd. De lichte woon- en eetkamer aan de voorzijde heeft grote ramen met vrij uitzicht op het groen. Aan de achterzijde ligt de royale hoofdslaapkamer met ingebouwde kast en tuindeuren naar de zonnige tuin op het zuidoosten, voorzien van twee opbergkasten. De centraal gelegen badkamer, toegankelijk vanuit de hal en slaapkamer, heeft een douche en wastafel. De rechte keuken is uitgerust met een oven, gaskookplaat, afzuigkap, vaatwasser en koelvrieskast, met de cv-installatie en een deur naar de tuin. De tweede slaapkamer, nu als werkkamer in gebruik, biedt ook toegang tot de tuin. Achter het complex bevindt zich een afgesloten (fiets)berging. Dit appartement combineert comfort, karakter en een gastvrije sfeer – een heerlijke plek om thuis te komen! Het weten waard: - Bouwjaar appartementencomplex 1952; - Appartement gelegen op eigen grond; - Woonoppervlakte ca. 73m²; - Actieve VVE; bijdrage € 240,- per maand (incl. waterverbruik en opstalverzekering); - Meerjarenonderhouds plan aanwezig; - Energielabel C; - Volledig voorzien van dubbel glas met houten ramen en kozijnen; - Ruim zonnige tuin op het zuidoosten over de volledige breedte van het appartement; - Eigen (fietsen-)berging achter het complex, middels stalen poort afgesloten van de straat; - Ruime (gratis) parkeergelegenheid voor de deur; - Warm water en verwarming middels eigen CV-installatie; - Overdracht vindplaats bij Werker Notariaat; - Ouderdoms- en niet zelfbewonersclausule worden opgenomen; - Oplevering in overleg. Deze informatie is door ons met de nodige zorgvuldigheid samengesteld. Onzerzijds wordt echter geen enkele aansprakelijkheid aanvaard voor enige onvolledigheid, onjuistheid of anderszins, dan wel de gevolgen daarvan. Alle opgegeven maten en oppervlakten zijn indicatief. Alle verstrekte informatie moet beschouwd worden als een uitnodiging tot het doen van een aanbod of om in onderhandeling te treden.
€ 400.000
Cost of copper (estimated): € 9.850
2% transfer tax (€ 8.000) + notary (€ 1.150) + valuation (€ 700)
Total purchase (incl. p.p.): € 409.850
3,02%
Yearly
€ 20.000
Direct available
Estimated mortgage
Indicative gross monthly cost
Based on annuity and 30 year term
Indicative net monthly cost
iDisclaimer: this mortgage calculation is a simplified indication based on general assumptions. No rights can be derived from the results shown. Calculated with 10-annual interest (met NHG), automatically determined based on the price limit € 470.000. Source: 10-jaars rente uit mortgage_rates (08-06-2026 03:45).
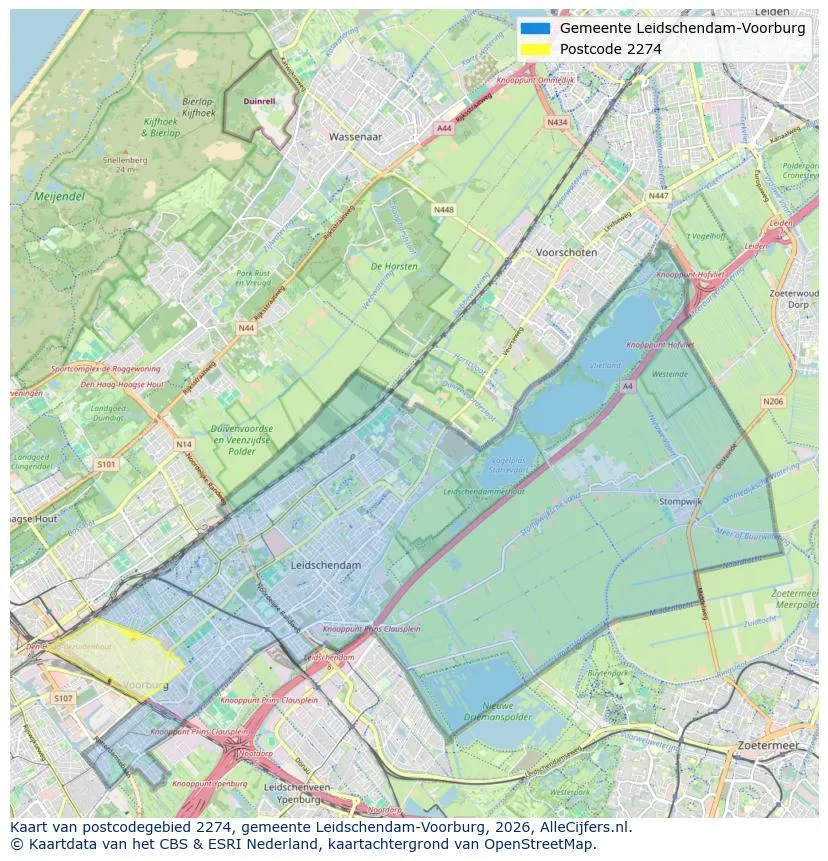
Geographic orientation and real estate agent density in Voorburg
View current location data on residents, WOZ development, housing stock, energy consumption, business activity and safety in Voorburg. In 2025 were there 43.030 residents. The average WOZ value in 2025 is EUR 458.888.
Residents
43.030
Last year: 2025
Average WOZ
EUR 458.888
Last year: 2025
Average income per person.
EUR 26.657
Source: AllNumbers
Crimes (current year)
2.147
Total registered
| Year | Residents |
|---|---|
| 2021 | 42.230 |
| 2022 | 42.330 |
| 2023 | 43.090 |
| 2024 | 43.300 |
| 2025 | 43.030 |
| Year | Average WOZ |
|---|---|
| 2021 | EUR 321.346 |
| 2022 | EUR 348.766 |
| 2023 | EUR 390.159 |
| 2024 | EUR 401.694 |
| 2025 | EUR 458.888 |
Hoger
16.470
Praktisch
5.590
Middelbaar
8.880
Europa
5.450
Nederland
26.395
Buiten Europa
11.200
Label C
4.850
Label E
3.513
Label D
3.239
Label G
2.686
Label F
2.294
Label A
2.241
Label B
1.988
Label A+
389
Label A++
355
Label A+++
252
Label A++++
57
Label A+++++
1
| Year | Gas (m3) | Electricity (kWh) |
|---|---|---|
| 2020 | 1.164 | 2.426 |
| 2021 | 1.321 | 2.485 |
| 2022 | 1.025 | 2.315 |
| 2023 | 881 | 2.182 |
| 2024 | 861 | 2.206 |
Hoekwoning
Gas: 1.206 • Electricity: 3.018
Huurwoning
Gas: 756 • Electricity: 1.784
Koopwoning
Gas: 948 • Electricity: 2.412
Appartement
Gas: 750 • Electricity: 1.816
Tussenwoning
Gas: 1.042 • Electricity: 2.762
Vrijstaande woning
Gas: 799 • Electricity: 1.625
Twee-onder-één-kap woning
Gas: 696 • Electricity: 1.762
Total number of company establishments: 5.770
| Period | Crimes |
|---|---|
| jan 2025 | 157 |
| jan 2026 | 201 |
| jul 2025 | 189 |
| jun 2025 | 183 |
| mei 2025 | 185 |
| mrt 2025 | 186 |
| nov 2024 | 166 |
| nov 2025 | 196 |
| okt 2024 | 190 |
| okt 2025 | 198 |
| sep 2024 | 174 |
| sep 2025 | 195 |
These figures give an indicative picture of safety trends in the living environment of Voorburg.
Short answers based on current local statistics, handy for a quick comparison of the living environment.
Voorburg telt in 2025 ongeveer 43.030 inwoners.
De gemiddelde WOZ-waarde in Voorburg is in 2025 circa € 458.888.
Het gemiddelde inkomen per inwoner in Voorburg ligt rond € 26.657 per jaar.
Voor het huidige jaar gaat het om ongeveer 2.147 geregistreerde misdrijven. Gebruik deze cijfers als indicatie en vergelijk trends per periode.
In Voorburg komt vooral "Appartementen" veel voor, met ongeveer 14.611 woningen.
View more homes in this location.
2271TN Voorburg
€ 495.000 k.k.
€ 5.562/m²

2274NA Voorburg
€ 435.000 k.k.
€ 5.800/m²

2274VE Voorburg
€ 625.000 k.k.
€ 4.808/m²
2274NZ Voorburg
€ 380.000 k.k.
€ 5.429/m²

2272SH Voorburg
€ 325.000 k.k.
€ 4.577/m²
2275VL Voorburg
€ 900.000 k.k.
€ 5.357/m²

2272WZ Voorburg
€ 1.245.000 k.k.
€ 6.225/m²

2275BG Voorburg
€ 575.000 k.k.
€ 3.485/m²
