Residents
36.070
Last year: 2025
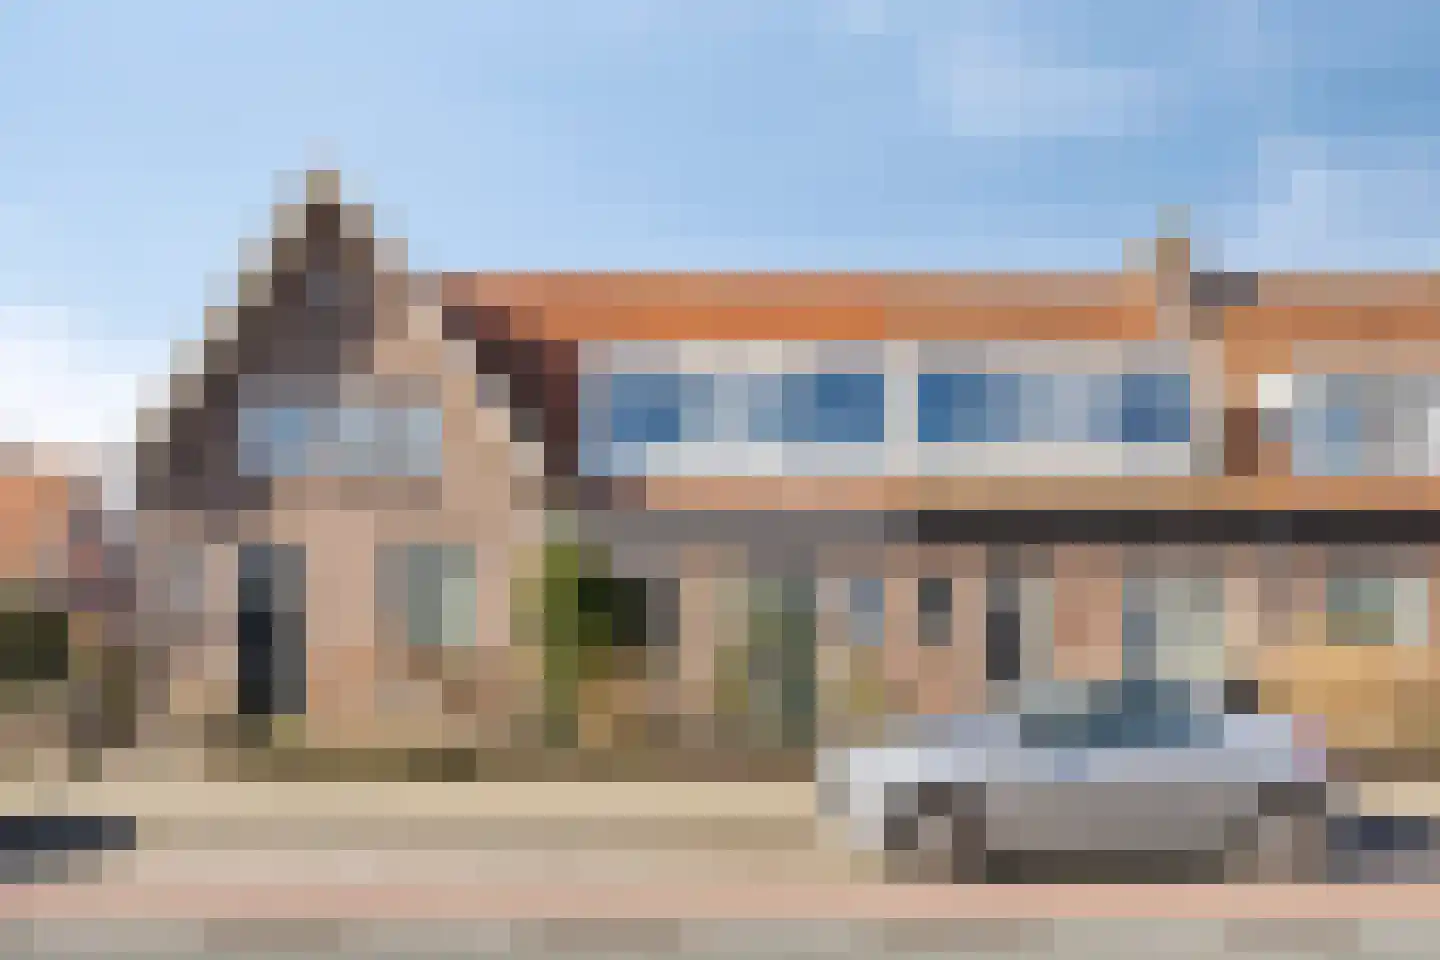
5142RN Waalwijk • Noord-Brabant
€ 390.000 k.k.
Cost of copper (estimated): € 9.650
2% transfer tax (€ 7.800) + notary (€ 1.150) + valuation (€ 700)
Total incl. VAT: € 399.650
Purchase price /m²: € 4.535
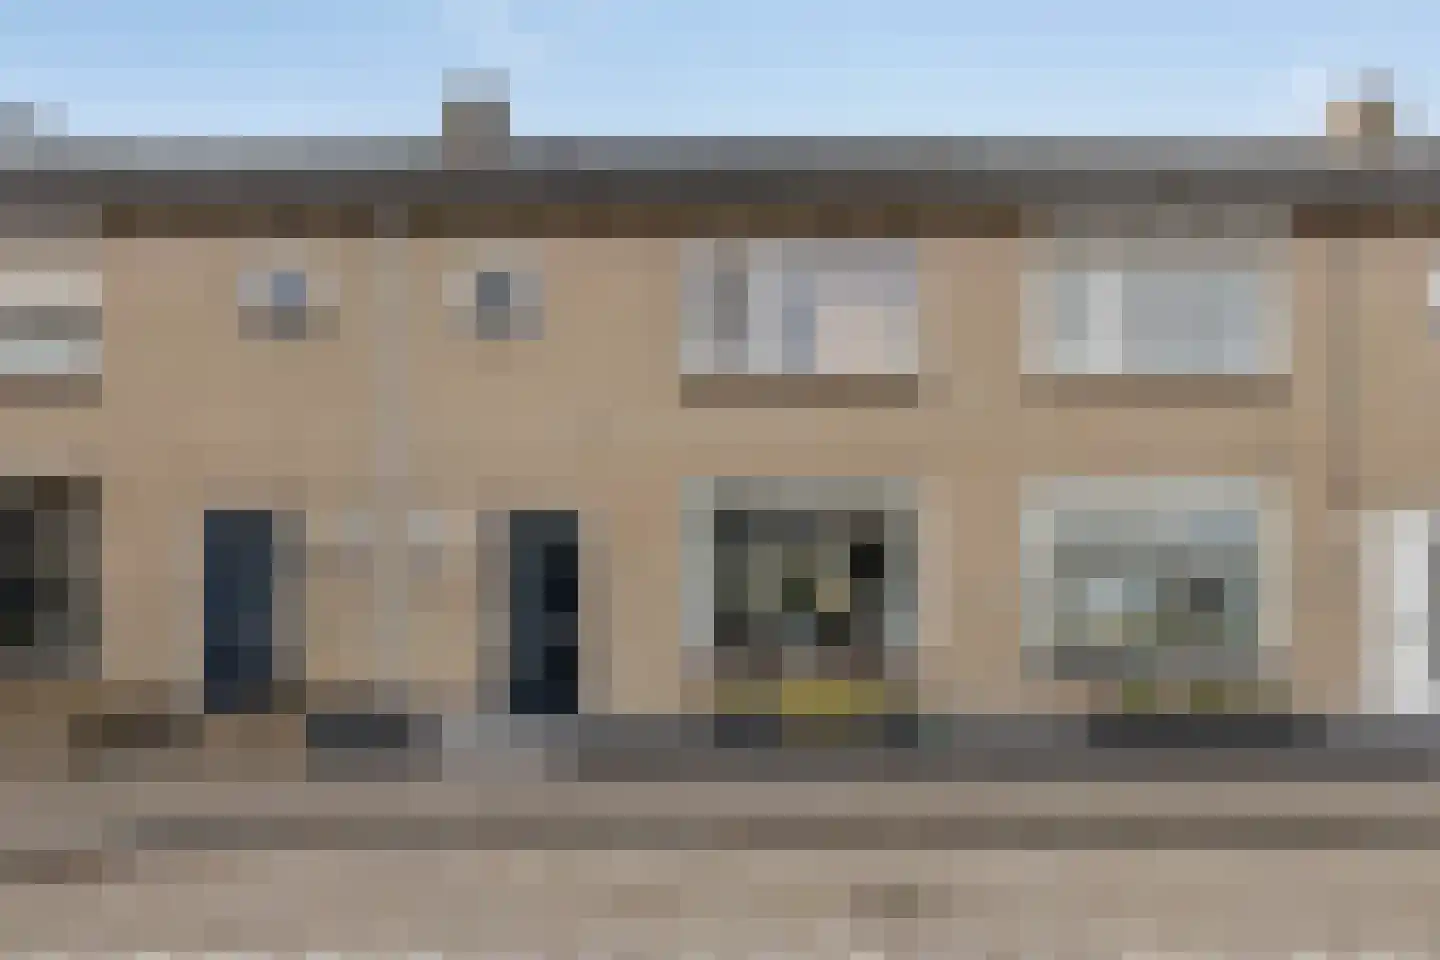
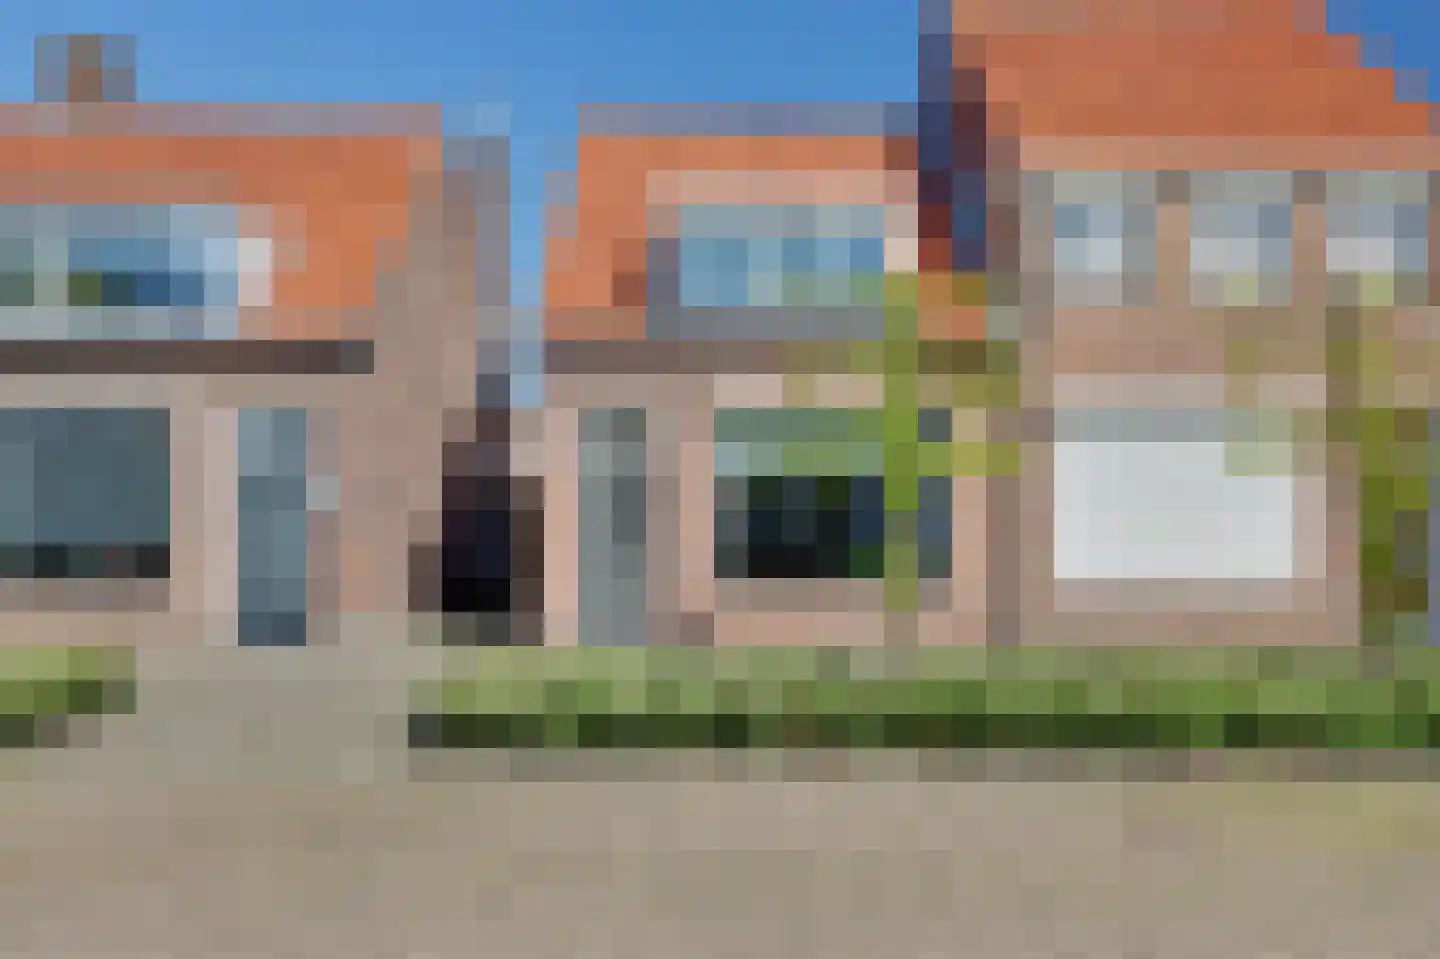
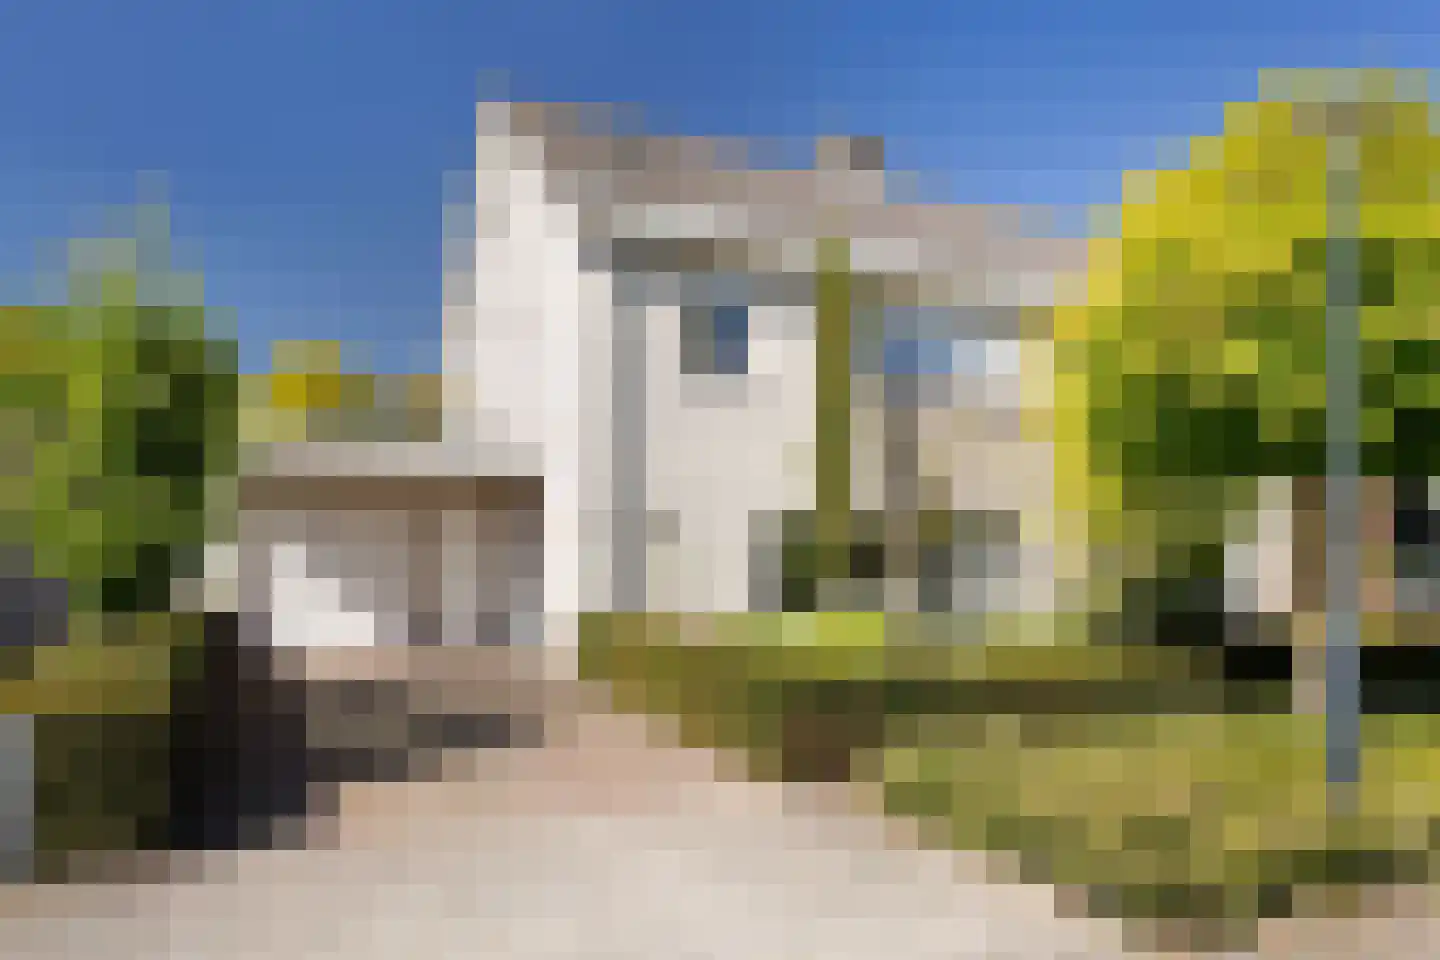
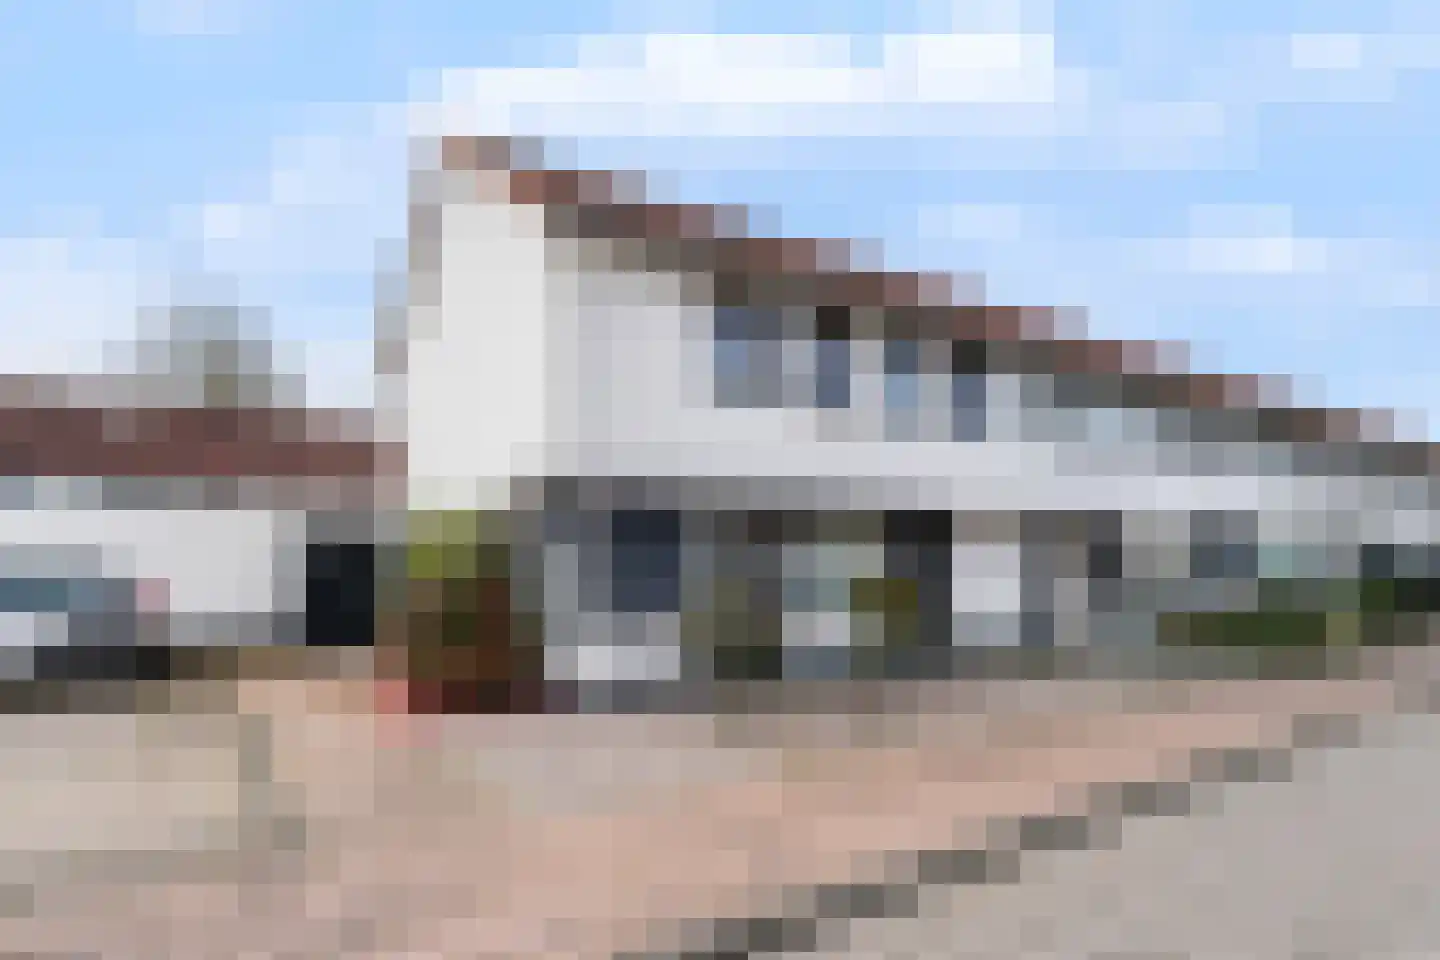
De woning aan Putstraat 122 in Waalwijk is een karaktervolle tussenwoning uit 1938 met een moderne keuken en badkamer, drie slaapkamers en zonnepanelen. De woonkamer heeft een warme stijl en de tuin met houten overkapping biedt comfort voor het hele jaar door. Het huis ligt nabij het centrum waar winkels eenvoudig bereikbaar zijn, heeft een HR cv-combiketel uit 2021 en is volledig voorzien van dubbel glas. De perceeloppervlakte bedraagt 117 m² met een inwonervoorziening van 328 m³ en een woonoppervlak van 86 m². Een bezichtiging biedt echte flair en comfort, aangevuld met duurzaamheidselementen zoals de zonnepanelen.
€ 390.000
Cost of copper (estimated): € 9.650
2% transfer tax (€ 7.800) + notary (€ 1.150) + valuation (€ 700)
Total purchase (incl. p.p.): € 399.650
2,78%
Yearly
€ 19.500
Direct available
Estimated mortgage
Indicative gross monthly cost
Based on annuity and 30 year term
Indicative net monthly cost
iDisclaimer: this mortgage calculation is a simplified indication based on general assumptions. No rights can be derived from the results shown. Calculated with 10-annual interest (met NHG), automatically determined based on the price limit € 470.000. Source: 10-jaars rente uit mortgage_rates (04-05-2026 03:45).
Douche, ligbad, en wastafel
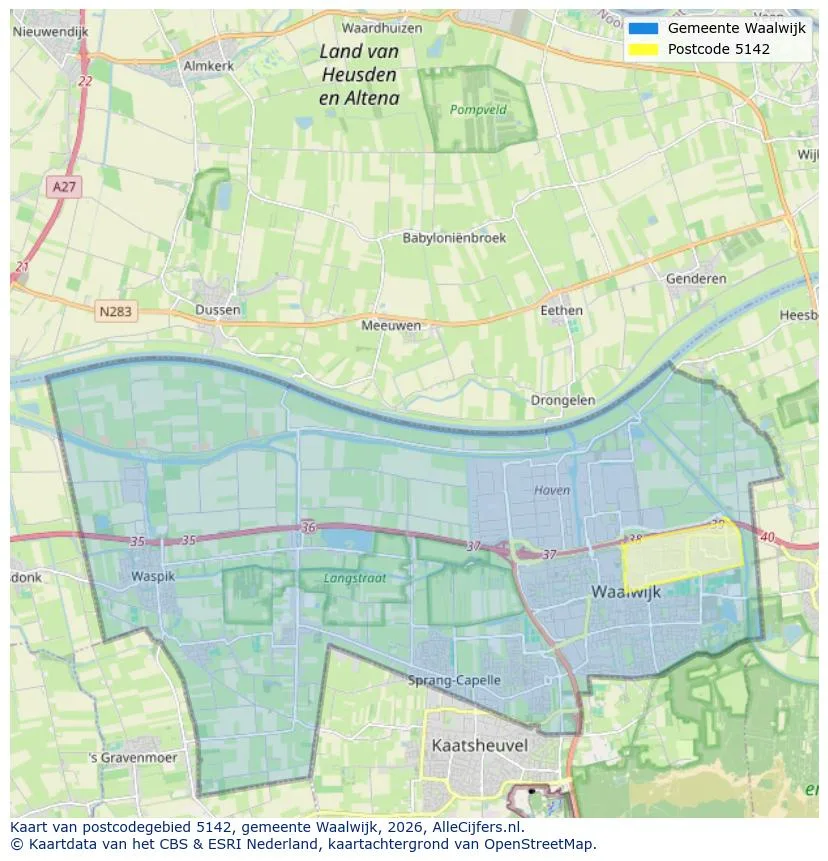
Discover where agents are active in Waalwijk
View current location data on residents, WOZ development, housing stock, energy consumption, business activity and safety in Waalwijk. In 2025 were there 36.070 residents. The average WOZ value in 2025 is EUR 359.426.
Residents
36.070
Last year: 2025
Average WOZ
EUR 359.426
Last year: 2025
Average income per person.
EUR 26.073
Source: AllNumbers
Crimes (current year)
1.439
Total registered
| Year | Residents |
|---|---|
| 2021 | 33.880 |
| 2022 | 34.415 |
| 2023 | 34.775 |
| 2024 | 35.060 |
| 2025 | 36.070 |
| Year | Average WOZ |
|---|---|
| 2021 | EUR 257.498 |
| 2022 | EUR 279.704 |
| 2023 | EUR 324.854 |
| 2024 | EUR 335.124 |
| 2025 | EUR 359.426 |
Hoger
5.620
Praktisch
8.070
Middelbaar
11.290
Europa
4.750
Nederland
25.670
Buiten Europa
5.635
Label A
4.481
Label C
4.342
Label B
2.608
Label D
1.377
Label E
877
Label G
745
Label F
743
Label A+++
439
Label A++++
428
Label A+
379
Label A++
366
Label A+++++
16
| Year | Gas (m3) | Electricity (kWh) |
|---|---|---|
| 2020 | 1.155 | 2.855 |
| 2021 | 1.288 | 2.895 |
| 2022 | 988 | 2.724 |
| 2023 | 852 | 2.574 |
| 2024 | 822 | 2.622 |
Hoekwoning
Gas: 964 • Electricity: 2.781
Huurwoning
Gas: 658 • Electricity: 1.995
Koopwoning
Gas: 975 • Electricity: 2.960
Appartement
Gas: 550 • Electricity: 1.766
Tussenwoning
Gas: 831 • Electricity: 2.597
Vrijstaande woning
Gas: 1.434 • Electricity: 4.057
Twee-onder-één-kap woning
Gas: 1.111 • Electricity: 3.244
Total number of company establishments: 4.860
| Period | Crimes |
|---|---|
| jan 2025 | 127 |
| jan 2026 | 112 |
| jul 2025 | 119 |
| jun 2025 | 95 |
| mei 2025 | 114 |
| mrt 2025 | 131 |
| nov 2024 | 125 |
| nov 2025 | 131 |
| okt 2024 | 150 |
| okt 2025 | 129 |
| sep 2024 | 106 |
| sep 2025 | 140 |
These figures give an indicative picture of safety trends in the living environment of Waalwijk.
Short answers based on current local statistics, handy for a quick comparison of the living environment.
Waalwijk telt in 2025 ongeveer 36.070 inwoners.
De gemiddelde WOZ-waarde in Waalwijk is in 2025 circa € 359.426.
Het gemiddelde inkomen per inwoner in Waalwijk ligt rond € 26.073 per jaar.
Voor het huidige jaar gaat het om ongeveer 1.439 geregistreerde misdrijven. Gebruik deze cijfers als indicatie en vergelijk trends per periode.
In Waalwijk komt vooral "Tussenwoningen" veel voor, met ongeveer 5.980 woningen.
View more homes in this location.
5144VA Waalwijk
€ 435.000 k.k.

5146DJ Waalwijk
€ 2.195 p/m
€ 16/m²

5144AT Waalwijk
€ 725.000 k.k.
5142EW Waalwijk
€ 325.000 k.k.

5142CA Waalwijk
€ 812 p/m
€ 35/m²

5141KK Waalwijk
€ 269.000 k.k.
€ 3.789/m²
5143JD Waalwijk
€ 650.000 k.k.
€ 4.037/m²
5141DJ Waalwijk
€ 515.000 k.k.
€ 4.858/m²
