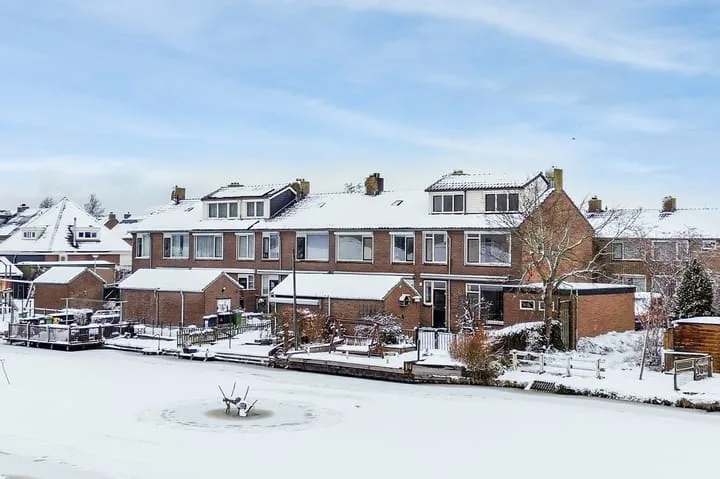
- Sold
Dorpsstraat 3 D
3366BC Wijngaarden
€ 539.000 k.k.
€ 3.934/m²
- Living area
- 137 m²
- Land area
- 254 m²
- Bedrooms
- 5
View 4 sold houses in Wijngaarden
Type to search. Use arrow down and arrow up to navigate through results and press Enter to open.
Hidden search suggestions.
Compare sold homes in Wijngaarden or view the current offering in this location directly.
On this page you will find recently sold homes in Wijngaarden. Use this overview to better estimate selling prices, popular neighborhoods, and the local housing supply before you choose a real estate agent. Also view the current housing supply with 5 houses in Wijngaarden.
3366BC Wijngaarden
€ 539.000 k.k.
€ 3.934/m²
3366BK Wijngaarden
€ 420.000 k.k.
€ 3.888/m²
3366BJ Wijngaarden
€ 550.000 k.k.
€ 5.670/m²
3366BG Wijngaarden
€ 699.000 k.k.
€ 4.262/m²
Bekijk recente verkopen en ontvang gratis offertes van lokale makelaars. Vergelijk meer dan 62 makelaars in Wijngaarden.
Zelf je woning verkopen in Wijngaarden? Vergelijk verkoopmakelaars in Wijngaarden of bekijk de beste verkoopmakelaars in Wijngaarden als referentie bij jouw keuze.
Makelaars maken scherpere voorstellen als ze weten dat je vergelijkt — vraag offertes aan voor verkoop of aankoop.
Short answers about housing prices, sold homes and comparing real estate agents in Wijngaarden.
De kosten van een makelaar in Wijngaarden verschillen per kantoor, woningtype en verkoopaanpak. In Wijngaarden kun je 62 real estate agents vergelijken; bekijk daarom ook de makelaars in Wijngaarden om tarieven, presentatie en lokale ervaring beter naast elkaar te zetten.
On this page we currently show 4 sold houses in Wijngaarden from our selection. This helps you to better assess recent transactions and the local housing market.
Houses sold in Wijngaarden give insight into asking prices, house types and neighborhoods where recent transactions have taken place. Compare this also with the current housing stock in Wijngaarden to better understand the market.
You can use sold homes as a first market indication, but a local real estate agent can better take into account finishing, location, maintenance and current demand in Wijngaarden.
Vergelijk de 62 real estate agents in Wijngaarden op lokale verkoopervaring, reviews, verwachte opbrengst, courtage en marketingaanpak. Bekijk verkoopmakelaars in Wijngaarden of de top 10 makelaars in Wijngaarden om snel sterke kantoren te ontdekken.
View current location data on residents, WOZ development, housing stock, energy consumption, business activity and safety in Wijngaarden. In 2025 were there 725 residents. The average WOZ value in 2025 is EUR 460.000.
These figures help to better assess and compare the housing stock in Wijngaarden with recent sold homes. Orient yourself then on suitable top real estate agents in Wijngaarden for sales advice in this region.
Residents
725
Last year: 2025
Average WOZ
EUR 460.000
Last year: 2025
Average income per person.
EUR 32.000
Source: AllNumbers
Crimes (current year)
23
Total registered
| Year | Residents |
|---|---|
| 2021 | 695 |
| 2022 | 720 |
| 2023 | 730 |
| 2024 | 730 |
| 2025 | 725 |
| Year | Average WOZ |
|---|---|
| 2021 | EUR 331.000 |
| 2022 | EUR 375.000 |
| 2023 | EUR 417.000 |
| 2024 | EUR 445.000 |
| 2025 | EUR 460.000 |
Hoger
120
Praktisch
90
Middelbaar
310
Europa
20
Nederland
685
Buiten Europa
25
Label C
56
Label G
48
Label A
39
Label D
36
Label B
31
Label E
15
Label F
9
Label A++
4
Label A+
3
Label A+++
2
Label A++++
0
Label A+++++
0
| Year | Gas (m3) | Electricity (kWh) |
|---|---|---|
| 2020 | 1.430 | 3.330 |
| 2021 | 1.650 | 3.540 |
| 2022 | 1.230 | 3.340 |
| 2023 | 1.060 | 3.180 |
| 2024 | 1.020 | 3.240 |
Hoekwoning
Gas: 850 • Electricity: 2.160
Huurwoning
Gas: 970 • Electricity: 2.550
Koopwoning
Gas: 1.080 • Electricity: 3.330
Appartement
Gas: 1.110 • Electricity: 3.280
Tussenwoning
Gas: 790 • Electricity: 2.670
Vrijstaande woning
Gas: 1.280 • Electricity: 3.960
Twee-onder-één-kap woning
Gas: 1.240 • Electricity: 3.530
Total number of company establishments: 115
| Period | Crimes |
|---|---|
| jan 2025 | 2 |
| jan 2026 | 5 |
| jul 2025 | 1 |
| jun 2025 | 1 |
| mei 2025 | 1 |
| mrt 2025 | 2 |
| nov 2024 | 4 |
| nov 2025 | 4 |
| okt 2024 | 3 |
| okt 2025 | 1 |
| sep 2024 | 2 |
| sep 2025 | 6 |
These figures give an indicative picture of safety trends in the living environment of Wijngaarden.
Short answers based on current local statistics, handy for a quick comparison of the living environment.
Wijngaarden telt in 2025 ongeveer 725 inwoners.
De gemiddelde WOZ-waarde in Wijngaarden is in 2025 circa € 460.000.
Het gemiddelde inkomen per inwoner in Wijngaarden ligt rond € 32.000 per jaar.
Voor het huidige jaar gaat het om ongeveer 23 geregistreerde misdrijven. Gebruik deze cijfers als indicatie en vergelijk trends per periode.
In Wijngaarden komt vooral "Vrijstaande woningen" veel voor, met ongeveer 89 woningen.