- Sold subject to confirmation
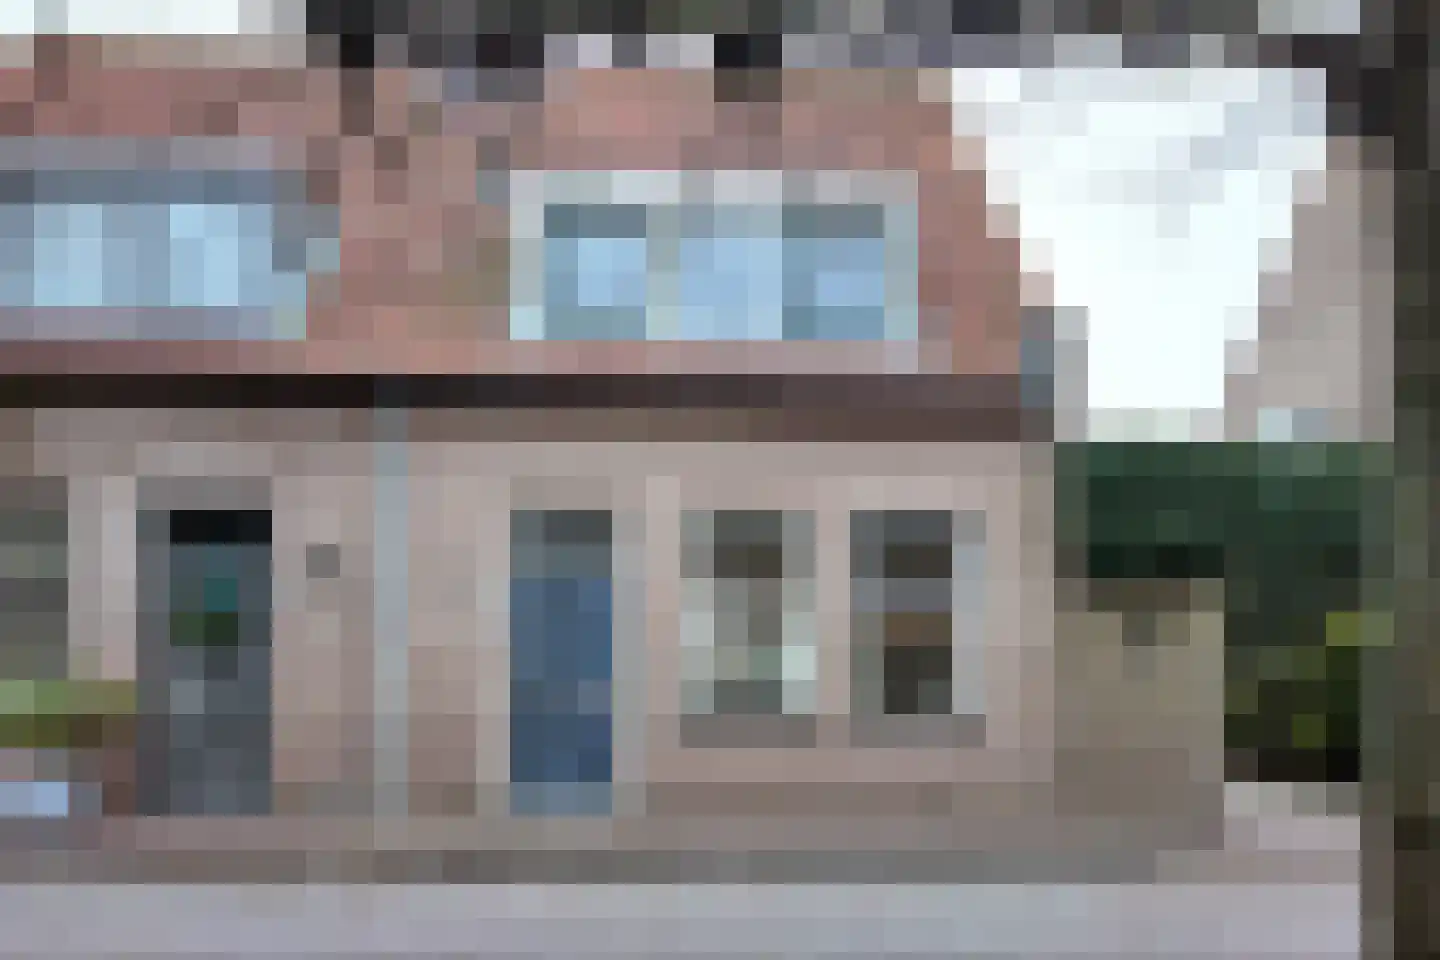
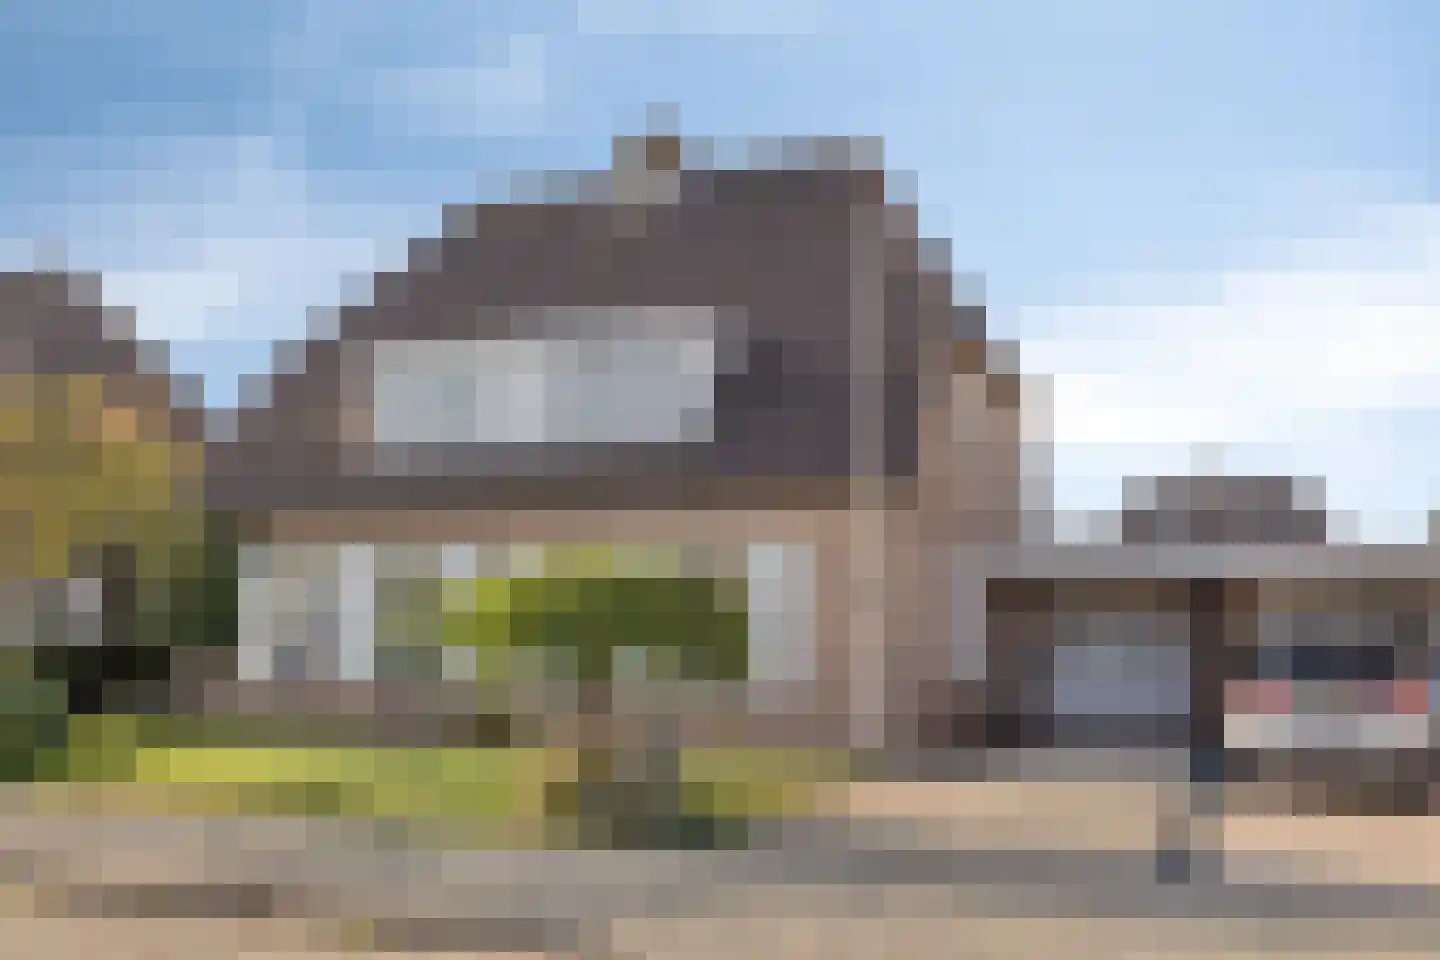
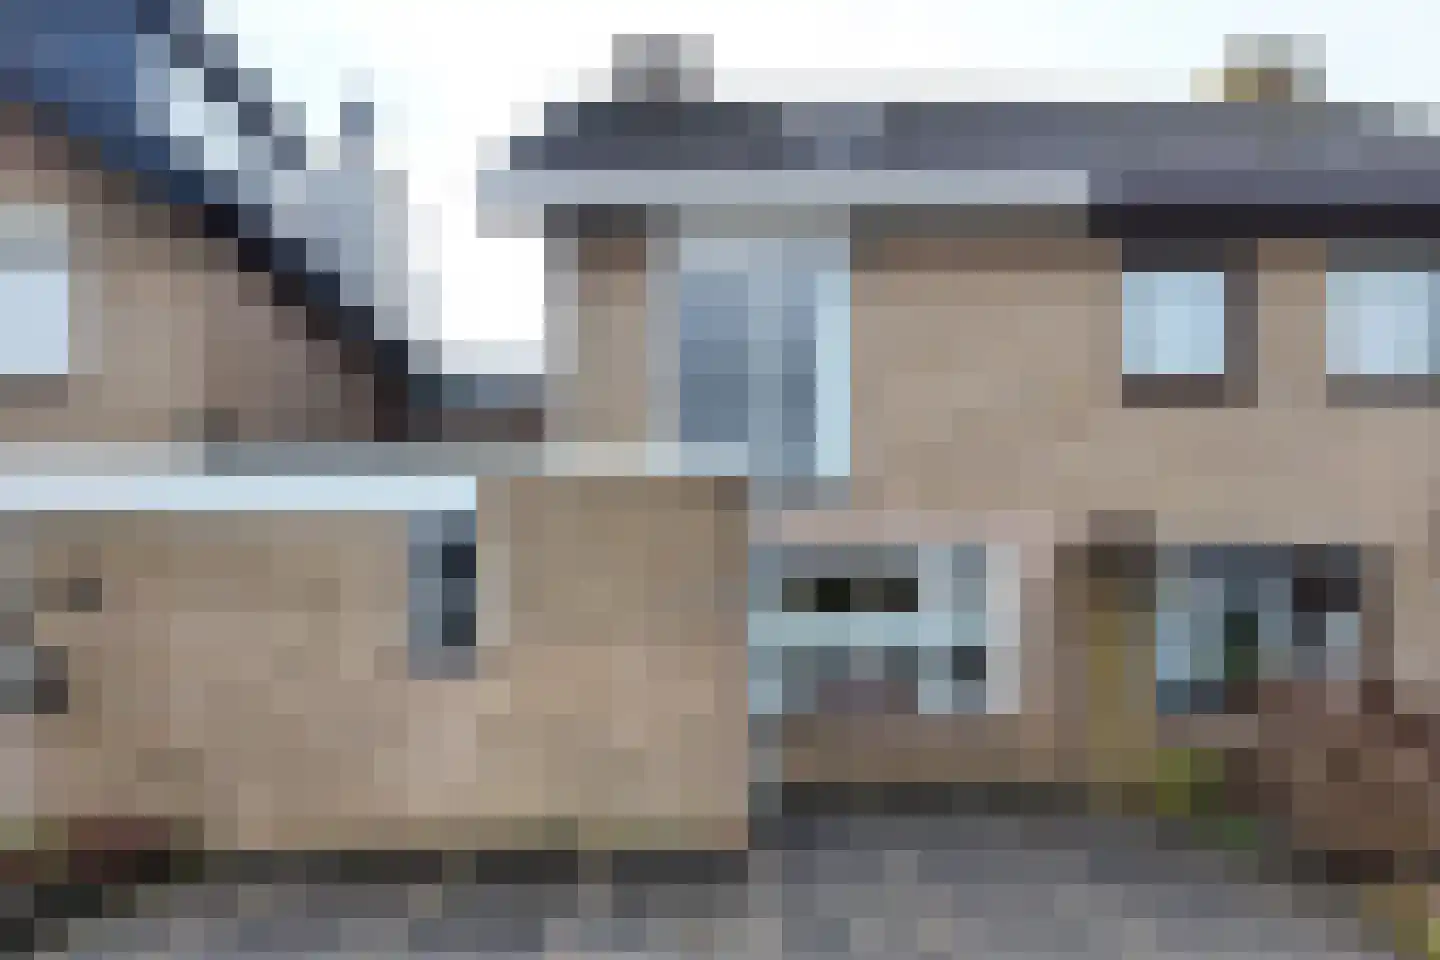
Andries Vierlinghlaan 5
4797CW Willemstad
€ 425.000 k.k.
€ 2.833/m²
- Living area
- 150 m²
- Land area
- 185 m²
- Bedrooms
- 3
Searching in 57 houses in Willemstad
Type to search. Use arrow down and arrow up to navigate through results and press Enter to open.
Hidden search suggestions.
View current properties in Willemstad or search targeted on street, postal code and property characteristics.
View the current housing stock in Willemstad and quickly filter by price, living area, rooms and more. There are currently 57 houses in this place within our selection. View also 31 sold houses in Willemstad for extra insight into the local housing market.
4797CW Willemstad
€ 425.000 k.k.
€ 2.833/m²
4797AN Willemstad
€ 275.000 k.k.
€ 3.928/m²
4797EB Willemstad
€ 715.000 k.k.
€ 3.994/m²
4797EP Willemstad
€ 700.000 k.k.
€ 3.910/m²
4797BB Willemstad
€ 400.000 k.k.
€ 4.301/m²
4797BT Willemstad
€ 849.500 k.k.
€ 3.861/m²
4797HB Willemstad
€ 240.000 k.k.
€ 2.526/m²
4797CW Willemstad
€ 450.000 k.k.
€ 3.308/m²
4797HP Willemstad
€ 475.000 k.k.
€ 4.095/m²
4797BX Willemstad
€ 369.000 k.k.
€ 2.882/m²
4797CV Willemstad
€ 517.500 k.k.
€ 3.723/m²
4797ES Willemstad
€ 875.000 k.k.
€ 5.503/m²
4797BZ Willemstad
€ 375.000 k.k.
€ 3.232/m²
4797SL Willemstad
€ 450.000 k.k.
€ 3.260/m²
4797HG Willemstad
€ 295.000 k.k.
€ 3.010/m²
4797SJ Willemstad
€ 400.000 k.k.
€ 3.669/m²
4797HK Willemstad
€ 224.000 k.k.
€ 2.909/m²
4797EV Willemstad
€ 500.000 k.k.
€ 3.816/m²
4797AS Willemstad
€ 335.000 k.k.
€ 3.284/m²
4797EN Willemstad
€ 850.000 k.k.
€ 0/m²
4797EJ Willemstad
€ 995.000 k.k.
€ 0/m²
4797EV Willemstad
€ 400.000 k.k.
€ 0/m²
4797AN Willemstad
€ 250.000 k.k.
€ 3.731/m²
4797BE Willemstad
€ 679.000 k.k.
€ 5.520/m²
4797AT Willemstad
€ 269.000 k.k.
€ 3.586/m²
4797EC Willemstad
€ 435.000 k.k.
€ 3.655/m²
4797EC Willemstad
€ 409.500 k.k.
€ 3.791/m²
4797EV Willemstad
€ 350.000 k.k.
€ 3.271/m²
Get free quotes from real estate agents with local market knowledge. Compare more than 21 real estate agents in Willemstad.
Selling a home in Willemstad? Compare all real estate agents in Willemstad or view the top 10 real estate agents in Willemstad for extra context for your choice.
Real estate agents make sharper offers when they know you're comparing — ask for quotes for sale or purchase.
Practical answers about housing supply, sales and comparing real estate agents in Willemstad.
The costs of a real estate agent in Willemstad depend on commission, setup costs, property presentation and the chosen service. Compare the 21 real estate agents in Willemstad via the real estate agent page and request multiple quotes to compare rates and approach well.
Within our selection, we are currently showing 57 houses in Willemstad. View also the sold houses in Willemstad to compare the current offering with recent transactions.
Take into account not only price and living area but also maintenance, energy label, location, outdoor space and sales status. This way you compare houses in Willemstad on more than just the asking price.
A local real estate agent knows the neighborhoods, recent transactions and demand in Willemstad. By comparing 21 real estate agents in the region you get a better insight into prices, sales strategy and expected yield; the top 10 in Willemstad provides a useful starting point.
Yes, when making a sales plan, a valuation in Willemstad is wise. You gain insight into a realistic asking price and can then compare offers from real estate agents specifically.
View current location data on residents, WOZ development, housing stock, energy consumption, business activity and safety in Willemstad. In 2025 were there 3.065 residents. The average WOZ value in 2025 is EUR 389.371.
These figures help to better assess and compare the housing stock in Willemstad with recent sold homes. Orient yourself then on suitable top real estate agents in Willemstad for sales advice in this region.
Residents
3.065
Last year: 2025
Average WOZ
EUR 389.371
Last year: 2025
Average income per person.
EUR 35.503
Source: AllNumbers
Crimes (current year)
57
Total registered
| Year | Residents |
|---|---|
| 2021 | 3.090 |
| 2022 | 3.105 |
| 2023 | 3.130 |
| 2024 | 3.070 |
| 2025 | 3.065 |
| Year | Average WOZ |
|---|---|
| 2021 | EUR 281.735 |
| 2022 | EUR 303.684 |
| 2023 | EUR 357.754 |
| 2024 | EUR 369.665 |
| 2025 | EUR 389.371 |
Hoger
520
Praktisch
580
Middelbaar
1.030
Europa
160
Nederland
2.655
Buiten Europa
260
Label C
437
Label A
378
Label B
230
Label D
147
Label F
98
Label G
81
Label E
59
Label A+
14
Label A++
5
Label A+++
3
Label A++++
0
Label A+++++
0
| Year | Gas (m3) | Electricity (kWh) |
|---|---|---|
| 2020 | 1.242 | 2.961 |
| 2021 | 1.411 | 3.003 |
| 2022 | 1.072 | 2.833 |
| 2023 | 931 | 2.706 |
| 2024 | 915 | 2.755 |
Hoekwoning
Gas: 959 • Electricity: 2.475
Huurwoning
Gas: 736 • Electricity: 1.954
Koopwoning
Gas: 1.031 • Electricity: 3.099
Appartement
Gas: 449 • Electricity: 1.319
Tussenwoning
Gas: 819 • Electricity: 2.361
Vrijstaande woning
Gas: 1.104 • Electricity: 3.155
Twee-onder-één-kap woning
Gas: 972 • Electricity: 2.971
Total number of company establishments: 445
| Period | Crimes |
|---|---|
| jan 2026 | 2 |
| jul 2025 | 4 |
| jun 2025 | 10 |
| mei 2025 | 4 |
| mrt 2025 | 3 |
| mrt 2026 | 5 |
| nov 2024 | 5 |
| nov 2025 | 4 |
| okt 2024 | 4 |
| okt 2025 | 6 |
| sep 2024 | 4 |
| sep 2025 | 3 |
These figures give an indicative picture of safety trends in the living environment of Willemstad.
Short answers based on current local statistics, handy for a quick comparison of the living environment.
Willemstad telt in 2025 ongeveer 3.065 inwoners.
De gemiddelde WOZ-waarde in Willemstad is in 2025 circa € 389.371.
Het gemiddelde inkomen per inwoner in Willemstad ligt rond € 35.503 per jaar.
Voor het huidige jaar gaat het om ongeveer 57 geregistreerde misdrijven. Gebruik deze cijfers als indicatie en vergelijk trends per periode.
In Willemstad komt vooral "Tussenwoningen" veel voor, met ongeveer 566 woningen.