Lotvan is uw betrouwbare partner voor expat-verhuizing en onroerend goed in Nederland, met een focus op Rotterdam, Den Haag en Amsterdam. Wij begrijpen hoe verhuizen naar een nieuwe stad – vooral in een ander land – kan zijn. Met jaren ervaring op de Nederlandse huurmarkt helpen wij expats het juiste huis te vinden, of dat nu huuren, kopen of investeren is. Onze team weet de uitdagingen van verhuizen te doorgronden, van het begrijpen va...
Current housing stock
-

- Available
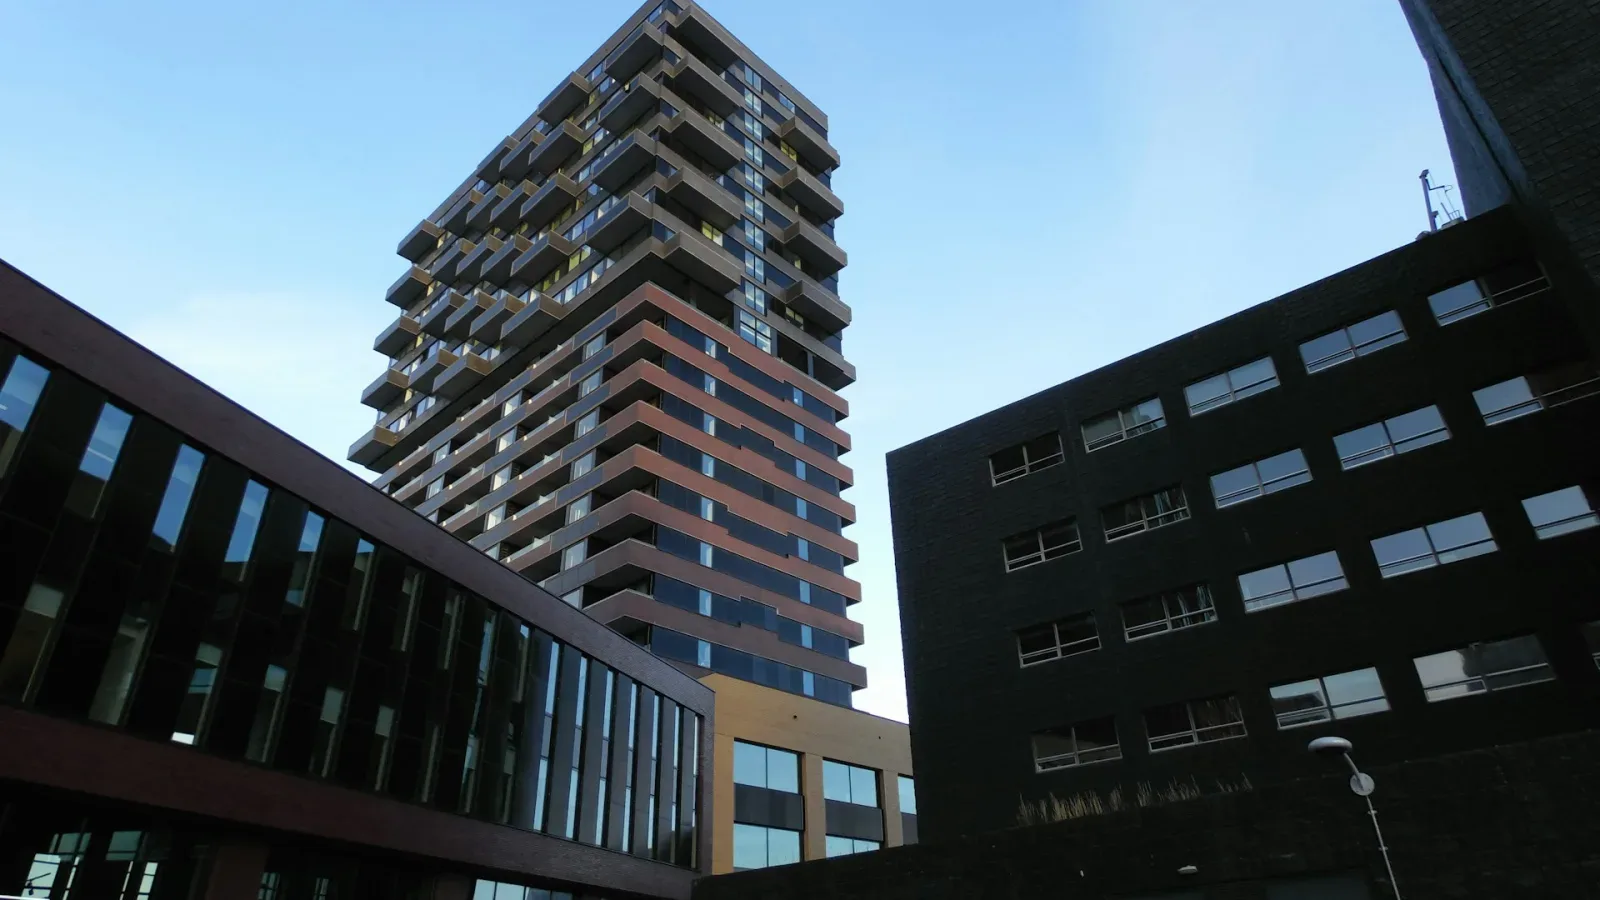
Nijverheidstraat
3071GB Rotterdam
Price upon request
Save as favorite- Living area
- 64 m²
- Land area
- —
- Bedrooms
- 2