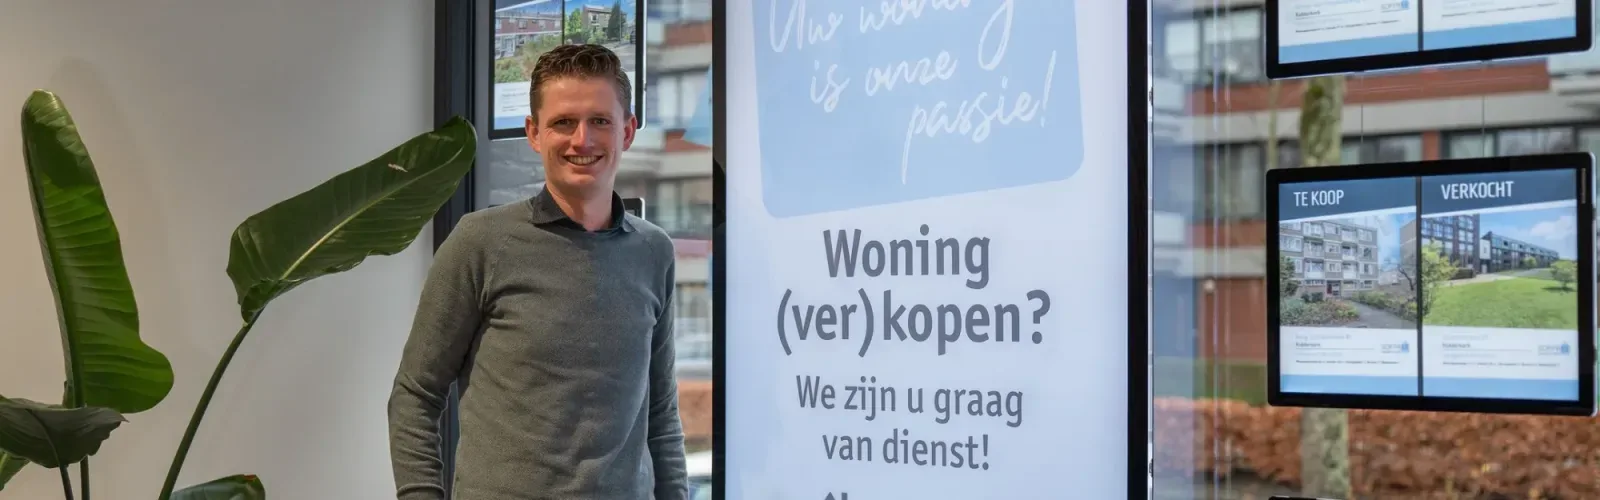

Soffree Makelaardij en Taxaties is een jonge, enthousiaste en professionele makelaar met veel kennis van de woningmarkt. Wij kijken naar elke klant als een persoon met unieke wensen en behoeften, want voor u is het niet alleen een woning, maar uw thuis. Wij zorgen ervoor dat u vanaf het eerste gesprek tot de overdracht bij de notaris volledig ondersteund wordt. Onze benadering is persoonlijk en transparant, met een sterke focus op klant...
Current housing stock
-

- Available
Nassaustraat 99
2983RC Ridderkerk
€ 450.000 k.k.
ESave as favorite- Living area
- 89 m²
- Land area
- 248 m²
- Bedrooms
- 3
-

- Available
Amaliastraat 30
2983EA Ridderkerk
€ 495.000 k.k.
DSave as favorite- Living area
- 83 m²
- Land area
- 275 m²
- Bedrooms
- 3
-

- Available
Emmastraat 31
3331XA Zwijndrecht
€ 350.000 k.k.
DSave as favorite- Living area
- 83 m²
- Land area
- 114 m²
- Bedrooms
- 3
-

- Available
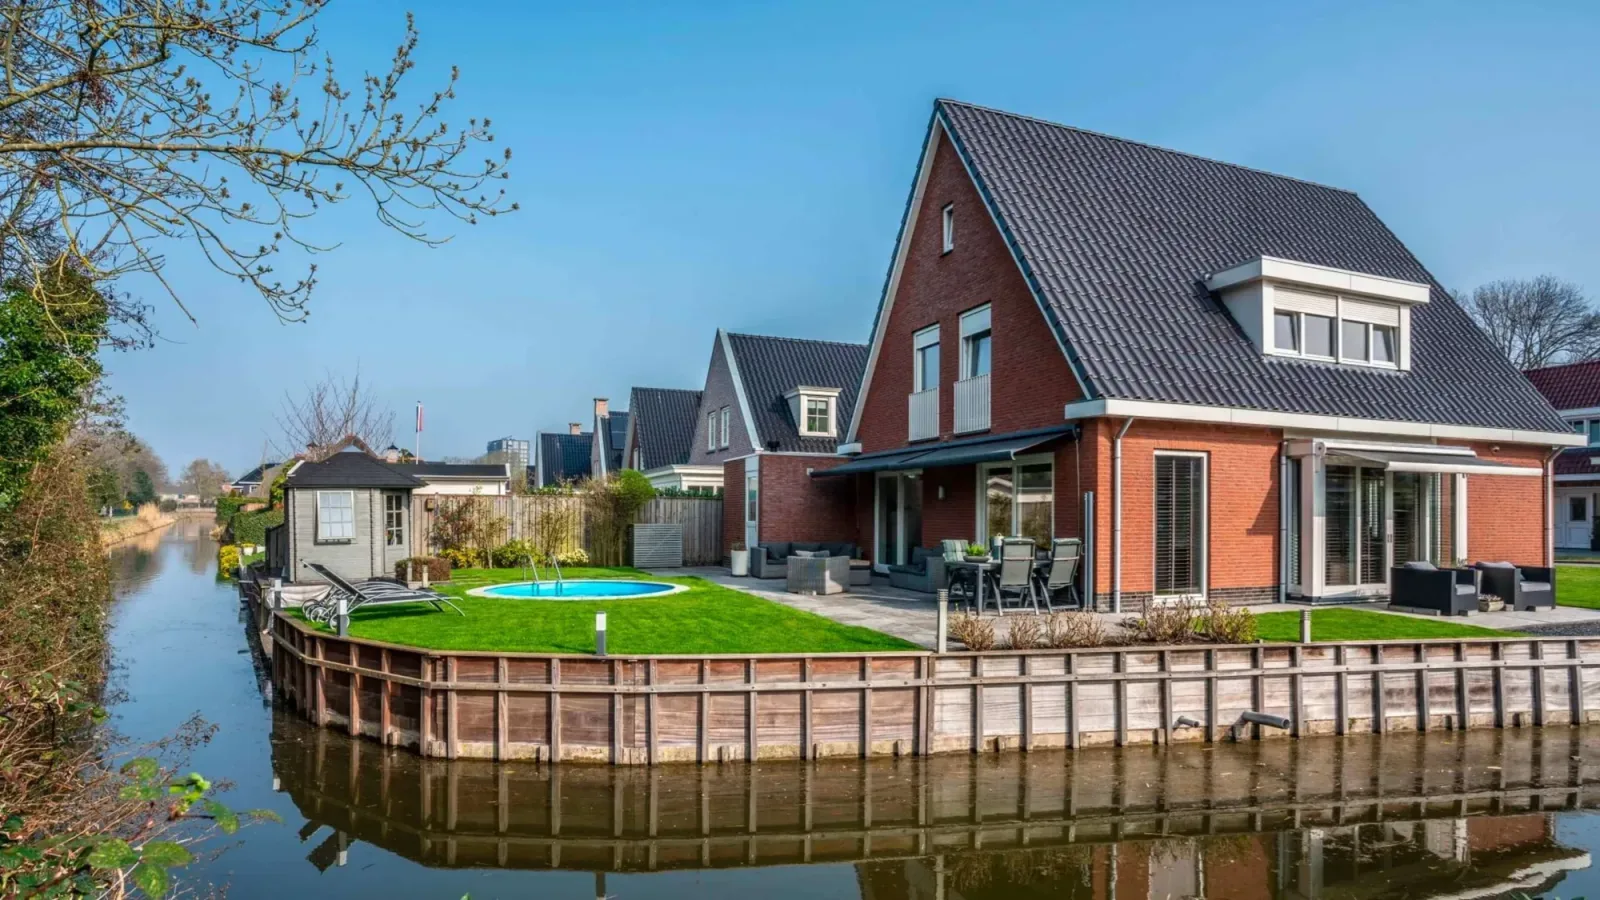
Molenleede 31
2991WB Barendrecht
€ 775.000 k.k.
€ 4.844/m²
ASave as favorite- Living area
- 160 m²
- Land area
- 253 m²
- Bedrooms
- 4
-

- Available
Lorentzstraat 34
2984EL Ridderkerk
€ 450.000 k.k.
€ 4.286/m²
ASave as favorite- Living area
- 105 m²
- Land area
- 133 m²
- Bedrooms
- 3
-

- Available
Johann Sebastian Bachstraat 18
2983AB Ridderkerk
€ 495.000 k.k.
€ 4.459/m²
ASave as favorite- Living area
- 111 m²
- Land area
- 162 m²
- Bedrooms
- 3
Reviews (167)
Review platforms
BronscoresTotal score
167 total reviews

Funda
80 reviews on Funda

87 reviews on Google
-
Erasmuslaan 55
10Robert is erg betrokken bij zijn klant en zeer professioneel. Maakt heldere afspraken en komt deze heel goed na. Steeds bereikbaar en alert en geeft supersnel terugkoppeling na verschillende acties. Je huis verkopen met een kwalitatief uitstekende makelaar? Neem contact op met Robert Soffree!
-
Vivaldistraat 21
9Prettige begeleiding en persoonlijk contact tijdens het hele verkooptraject. Zeer kundige en zorgvuldige makelaar, oog voor details die een zeer goede inschatting oplevert van de meerwaarde van de woning voor toekomstige kopers. Ik kan Robert Soffree zeker aanbevelen om uit te nodigen voor een kennismakingsgesprek, En succes met jullie overweging en toekomstigeverkoop👍🏻
-
Clara Wichmannstraat 43
9Het contact met de makelaar verliep goed en vlot. Via Whatsapp werden we goed op de hoogte gehouden van het verloop van de verkoop, bezichtigingen etc.. We kunnen deze makelaar zeker aanbevelen.
-
Kraanbaan 9
10Translated by AII had 3 real estate agents come over. The choice fell on Soffree, because Robert had a good story, assessed our house at value and is familiar with the area. Robert does what he says, is easy to reach and really thinks with you. I had the feeling that he wanted to get the best price for our house rather than selling it quickly.
-
Graaf Lodewijkstraat 10
10Was enorm fijn samenwerken! Hij weet waar hij het over heeft en was erg aardig. Het verkoopproces verliep gemakkelijk en wij werden goed of de hoogte gehouden van alle ontwikkelingen
-
Simone Smit
10Fijne eerlijke en transparante makelaar. Werkt zorgvuldig en komt met goed advies!
-
Annette Moolenaar
10Mijn huis is getaxeerd door Soffree Makelaardij en Taxaties. Ik ben erg tevreden over het bezoek van de firma Soffree. Het bezoek verliep zonder enige problemen. Hartelijk dank firma Soffree.
-
Van Lennepstraat 131
10Vanaf het begin tot aan de definitieve verkoop zijn wij goed begeleid en geholpen. Zeker een aanrader!
-
Groen van Prinstererweg 41
10Het was geen gemakkelijke locatie om te huis te verkopen maar uiteindelijk heeft Robert het fantastisch gedaan. Zowel de begeleiding vooraf als tijdens de verkoop. Hij houdt de verkoper continue op de hoogte en stuurt bij waar nodig.
-
Hoofdstraat 104
10Zeer fijne en correcte makelaar, heeft al meerdere woningen voor ons verkocht en altijd naar volle tevredenheid.
-
Kapteynstraat 20
10Deskundige makelaar. Weet waar hij het over heeft. Komt zijn afspraken na. Ook een prettige manier van communiceren met hem ervaren.
-
Kinan Mak
10aangename contact met Robert, kortom netjes makelaar
-
Johan Loo
10 -
Alana
10Snel, deskundig en goed geholpen met mijn taxatie, dank Robert!
-
Jhr. De Savornin Lohmanstraat 34
10Een hele fijne en betrouwbare makelaar. De dienst was zeer waardevol. Duidelijke uitleg, Informeel en formeel wanneer nodig. Direct antwoorden op vragen en een overtuigende deskundigheid, met een resultaat boven verwachting.
-
Arash
10Een hele fijne ervaring gehad met deze makelaar. Er is ontzettend veel aandacht gedurende het hele proces van verkoop. Robert denkt met je mee en zorgt ervoor dat je continu op de hoogte bent van elke stap in het proces.
-
Rianne Bos
10Zowel bij de aankoop van ons nieuwe huis en de verkoop van het oude huis zijn we uitstekend begeleidt door Robert. Duidelijke communicatie en korte lijntjes. Hij geeft eerlijk advies en weet waar hij over praat. Kortom echt een aanrader!!
-
Noordmansstraat 8
10Deze makelaar heeft ons vanaf het begin van kennismaking tot en met het afronden van de verkoop zeer goed begeleid. Bij vragen staat de makelaar direct voor je klaar met gedegen advies. De makelaar komt voorbereid het proces in en weet goed hoe de markt in elkaar zit. Echt een aanrader!
-
Burgemeester Crezéestraat 81
10Translated by AIWe are extremely satisfied with our real estate agent. From the first moment of contact until completion, he handled everything superbly. He was always available, thought along with us and took the time to explain everything clearly. Thanks to his dedication and knowledge, the entire process went smoothly without any stress. You just know that he knows what he's doing and that he is fully committed to his clients. We look back on this with a very positive view and would definitely recommend him to everyone...
-
Van Riebeekstraat 37
10Translated by AIRobert is extremely dedicated and has guided us very well. His insight into the current market and strategy on it has helped us a lot.