
Residents
7.235
Last year: 2025
1619EH Andijk • Noord-Holland
€ 97.000 k.k.
Cost of copper (estimated): € 3.790
2% transfer tax (€ 1.940) + notary (€ 1.150) + valuation (€ 700)
Total incl. VAT: € 100.790
Purchase price /m²: € 2.490
Proefpolder 83 in Andijk biedt een recreatief verblijf van circa 55m² woonoppervlak en 249m² erfpachtgrond aan het water. De woning is goed onderhouden met zonnepanelen, een moderne keuken en badkamer, waardoor energiekosten beperkt zijn. Ze heeft twee slaapkamers, woonkamer, hal met wasruimte en patio voor buitenleven. De ligging nabij het IJsselmeer maakt recreatieve activiteiten zoals water- en strandactiviteiten mogelijk, terwijl de omgeving ook musea, horecapleinen en historische stadjes biedt. Andijk is toegankelijk via A7 en busverbindingen, wat het ideaal maakt voor seizoensgebruik of langere verblijfperiodes.
€ 97.000
Cost of copper (estimated): € 3.790
2% transfer tax (€ 1.940) + notary (€ 1.150) + valuation (€ 700)
Total purchase (incl. p.p.): € 100.790
3,07%
Yearly
€ 4.850
Direct available
Estimated mortgage
Indicative gross monthly cost
Based on annuity and 30 year term
Indicative net monthly cost
iDisclaimer: this mortgage calculation is a simplified indication based on general assumptions. No rights can be derived from the results shown. Calculated with 10-annual interest (met NHG), automatically determined based on the price limit € 470.000. Source: 10-jaars rente uit mortgage_rates (10-06-2026 03:45).
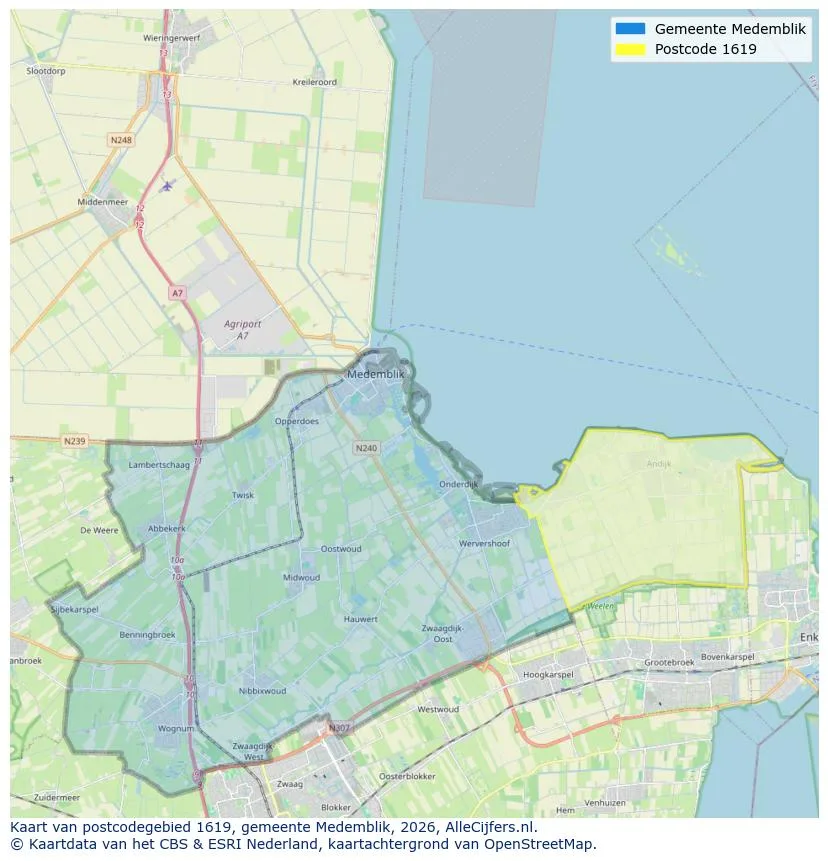
View the location and discover the brokers in this region
View current location data on residents, WOZ development, housing stock, energy consumption, business activity and safety in Andijk. In 2025 were there 7.235 residents. The average WOZ value in 2025 is EUR 398.000.
Residents
7.235
Last year: 2025
Average WOZ
EUR 398.000
Last year: 2025
Average income per person.
EUR 31.800
Source: AllNumbers
Crimes (current year)
137
Total registered
| Year | Residents |
|---|---|
| 2021 | 7.005 |
| 2022 | 7.085 |
| 2023 | 7.200 |
| 2024 | 7.225 |
| 2025 | 7.235 |
| Year | Average WOZ |
|---|---|
| 2021 | EUR 273.000 |
| 2022 | EUR 300.000 |
| 2023 | EUR 356.000 |
| 2024 | EUR 373.000 |
| 2025 | EUR 398.000 |
Hoger
1.070
Praktisch
1.880
Middelbaar
2.440
Europa
930
Nederland
5.785
Buiten Europa
525
Label A
926
Label C
661
Label G
439
Label B
424
Label D
199
Label F
127
Label A++
115
Label A+
69
Label E
64
Label A+++
53
Label A++++
20
Label A+++++
0
| Year | Gas (m3) | Electricity (kWh) |
|---|---|---|
| 2020 | 1.280 | 3.040 |
| 2021 | 1.430 | 3.160 |
| 2022 | 1.090 | 2.960 |
| 2023 | 920 | 2.880 |
| 2024 | 880 | 2.970 |
Hoekwoning
Gas: 820 • Electricity: 2.580
Huurwoning
Gas: 630 • Electricity: 2.250
Koopwoning
Gas: 1.030 • Electricity: 3.120
Appartement
Gas: 520 • Electricity: 1.740
Tussenwoning
Gas: 730 • Electricity: 2.390
Vrijstaande woning
Gas: 1.150 • Electricity: 3.550
Twee-onder-één-kap woning
Gas: 990 • Electricity: 2.950
Total number of company establishments: 1.010
| Period | Crimes |
|---|---|
| jan 2025 | 9 |
| jan 2026 | 21 |
| jul 2025 | 12 |
| jun 2025 | 12 |
| mei 2025 | 18 |
| mrt 2025 | 12 |
| nov 2024 | 13 |
| nov 2025 | 9 |
| okt 2024 | 19 |
| okt 2025 | 10 |
| sep 2024 | 10 |
| sep 2025 | 5 |
These figures give an indicative picture of safety trends in the living environment of Andijk.
Short answers based on current local statistics, handy for a quick comparison of the living environment.
Andijk telt in 2025 ongeveer 7.235 inwoners.
De gemiddelde WOZ-waarde in Andijk is in 2025 circa € 398.000.
Het gemiddelde inkomen per inwoner in Andijk ligt rond € 31.800 per jaar.
Voor het huidige jaar gaat het om ongeveer 137 geregistreerde misdrijven. Gebruik deze cijfers als indicatie en vergelijk trends per periode.
In Andijk komt vooral "Vrijstaande woningen" veel voor, met ongeveer 1.221 woningen.
View more homes in this location.

1619BL Andijk
€ 165.000 k.k.

1619BL Andijk
€ 725.000 k.k.
€ 4.475/m²

1619EH Andijk
€ 95.000 k.k.
1619CV Andijk
€ 325.000 k.k.
€ 2.731/m²

1619VX Andijk
€ 1.195.000 k.k.
€ 3.983/m²

1619EZ Andijk
€ 400.000 k.k.
€ 3.846/m²

1619JH Andijk
€ 450.000 k.k.
€ 4.412/m²

1619BZ Andijk
€ 750.000 k.k.
€ 5.034/m²
