- Available
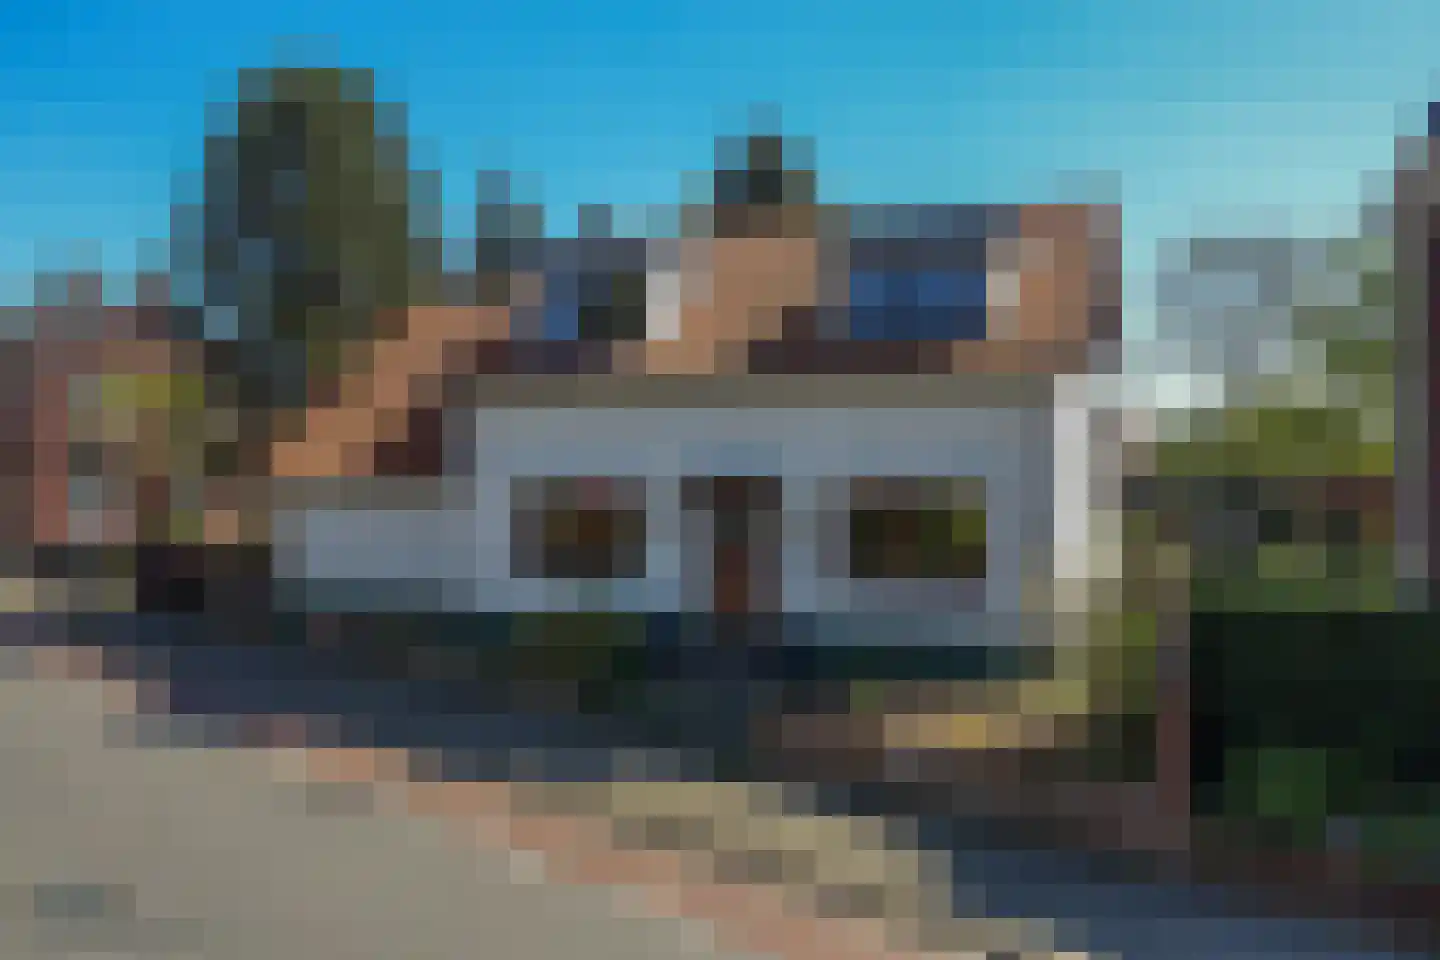
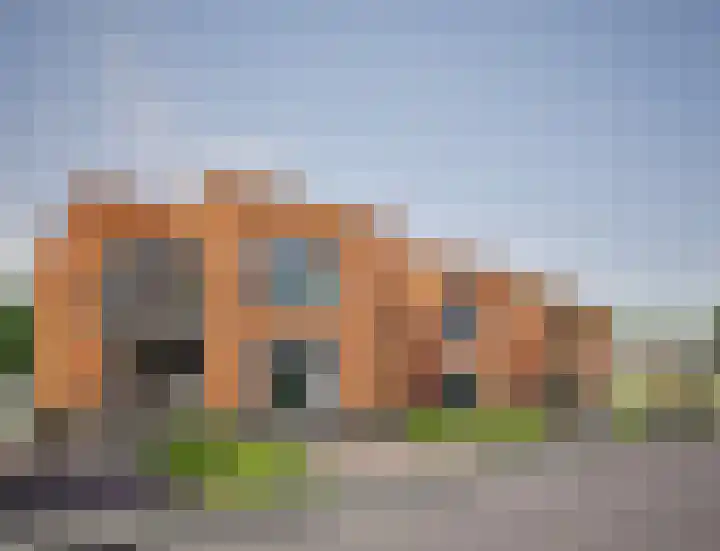
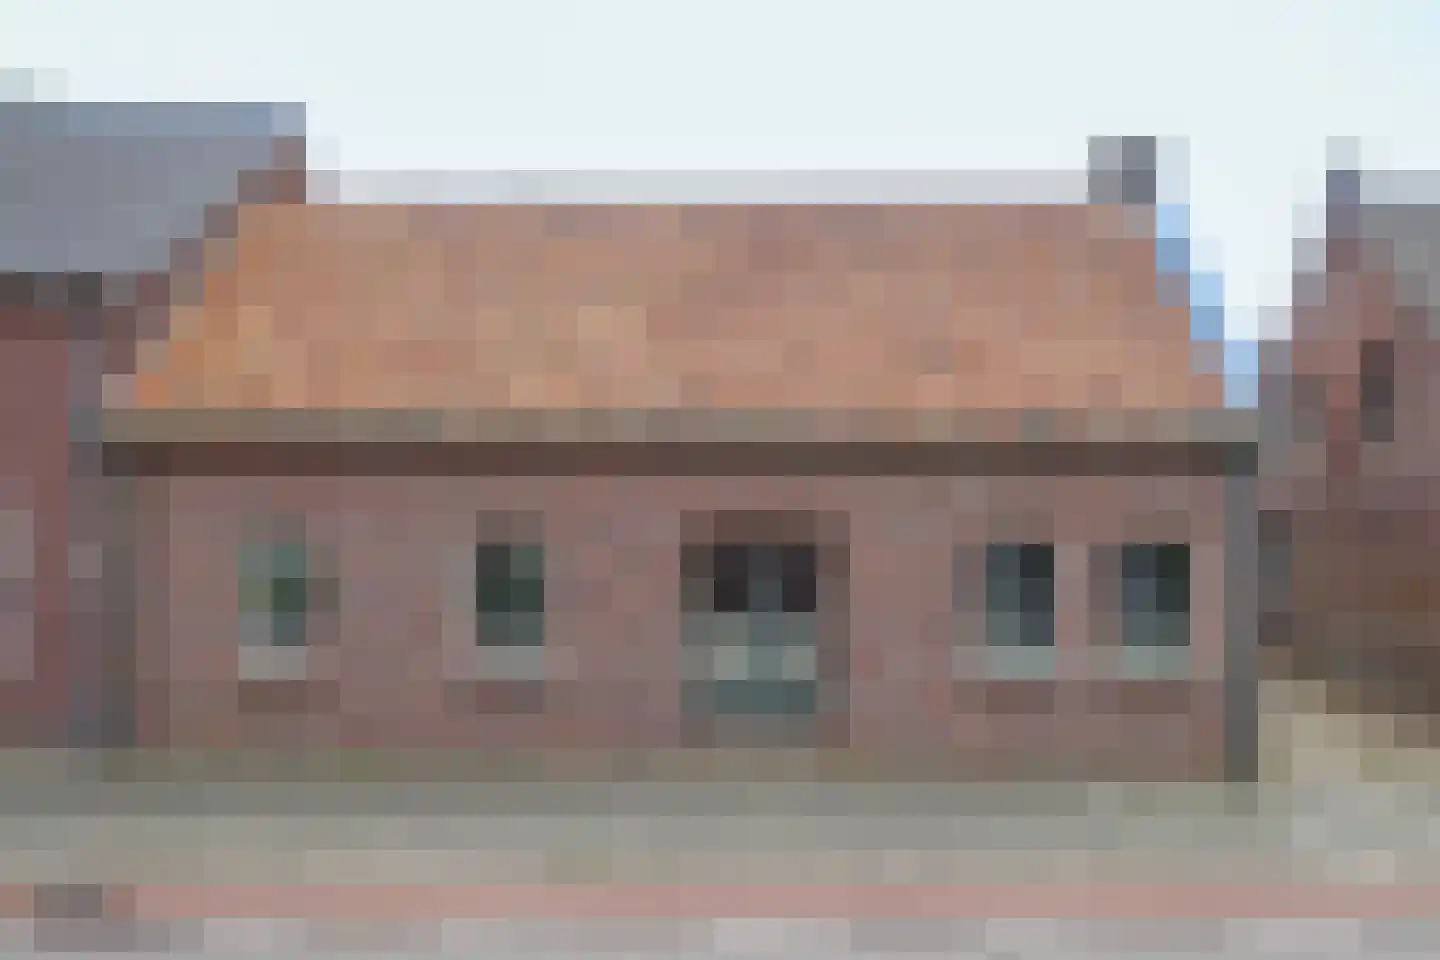
Burgemeester Janssenstraat 7
5954BN Beesel
€ 425.000 k.k.
€ 3.864/m²
- Living area
- 110 m²
- Land area
- 740 m²
- Bedrooms
- 2
Searching in 27 houses in Beesel
Type to search. Use arrow down and arrow up to navigate through results and press Enter to open.
Hidden search suggestions.
View current properties in Beesel or search targeted on street, postal code and property characteristics.
View the current housing stock in Beesel and quickly filter by price, living area, rooms and more. There are currently 27 houses in this place within our selection. View also 21 sold houses in Beesel for extra insight into the local housing market.
5954BN Beesel
€ 425.000 k.k.
€ 3.864/m²
5954NJ Beesel
€ 1.195.000 k.k.
€ 1.912/m²
5954AC Beesel
€ 575.000 k.k.
5954CX Beesel
€ 385.000 k.k.
€ 2.984/m²
5954AG Beesel
€ 375.000 k.k.
€ 3.505/m²
5954AL Beesel
€ 375.000 k.k.
€ 3.289/m²
5954NX Beesel
€ 545.000 k.k.
€ 3.225/m²
5954CM Beesel
€ 339.000 k.k.
€ 3.110/m²
5954CM Beesel
€ 359.500 k.k.
€ 3.268/m²
5954NB Beesel
€ 450.000 k.k.
€ 2.631/m²
5954AW Beesel
€ 775.000 k.k.
€ 4.613/m²
5954NX Beesel
€ 395.000 k.k.
€ 3.264/m²
5954NB Beesel
€ 285.000 k.k.
€ 3.433/m²
5954NJ Beesel
€ 585.000 k.k.
€ 3.112/m²
5954AS Beesel
€ 775.000 k.k.
€ 3.075/m²
5954AH Beesel
€ 280.000 k.k.
€ 2.800/m²
5954AX Beesel
€ 265.000 k.k.
€ 2.623/m²
5954BR Beesel
€ 379.000 k.k.
€ 2.960/m²
5954NK Beesel
€ 465.000 k.k.
€ 3.632/m²
5954AE Beesel
€ 499.000
€ 3.326/m²
5954AE Beesel
€ 345.000
€ 3.349/m²
5954AE Beesel
€ 345.000
€ 3.349/m²
5954AE Beesel
€ 279.890
€ 3.731/m²
5954CM Beesel
€ 425.000 k.k.
€ 2.777/m²
5954AN Beesel
€ 415.000
€ 3.990/m²
5954BV Beesel
€ 459.000 k.k.
€ 3.375/m²
5954AW Beesel
€ 450.000 k.k.
€ 2.743/m²
Get free quotes from real estate agents with local market knowledge. Compare more than 33 real estate agents in Beesel.
Selling a home in Beesel? Compare all real estate agents in Beesel or view the top 10 real estate agents in Beesel for extra context for your choice.
Real estate agents make sharper offers when they know you're comparing — ask for quotes for sale or purchase.
Practical answers about housing supply, sales and comparing real estate agents in Beesel.
The costs of a real estate agent in Beesel depend on commission, setup costs, property presentation and the chosen service. Compare the 33 real estate agents in Beesel via the real estate agent page and request multiple quotes to compare rates and approach well.
Within our selection, we are currently showing 27 houses in Beesel. View also the sold houses in Beesel to compare the current offering with recent transactions.
Take into account not only price and living area but also maintenance, energy label, location, outdoor space and sales status. This way you compare houses in Beesel on more than just the asking price.
A local real estate agent knows the neighborhoods, recent transactions and demand in Beesel. By comparing 33 real estate agents in the region you get a better insight into prices, sales strategy and expected yield; the top 10 in Beesel provides a useful starting point.
Yes, when making a sales plan, a valuation in Beesel is wise. You gain insight into a realistic asking price and can then compare offers from real estate agents specifically.
View current location data on residents, WOZ development, housing stock, energy consumption, business activity and safety in Beesel. In 2025 were there 2.430 residents. The average WOZ value in 2025 is EUR 390.000.
These figures help to better assess and compare the housing stock in Beesel with recent sold homes. Orient yourself then on suitable top real estate agents in Beesel for sales advice in this region.
Residents
2.430
Last year: 2025
Average WOZ
EUR 390.000
Last year: 2025
Average income per person.
EUR 34.000
Source: AllNumbers
Crimes (current year)
58
Total registered
| Year | Residents |
|---|---|
| 2021 | 2.445 |
| 2022 | 2.435 |
| 2023 | 2.440 |
| 2024 | 2.415 |
| 2025 | 2.430 |
| Year | Average WOZ |
|---|---|
| 2021 | EUR 294.000 |
| 2022 | EUR 307.000 |
| 2023 | EUR 354.000 |
| 2024 | EUR 359.000 |
| 2025 | EUR 390.000 |
Hoger
600
Praktisch
390
Middelbaar
860
Europa
215
Nederland
2.145
Buiten Europa
70
Label C
227
Label B
195
Label A
161
Label D
143
Label G
138
Label F
116
Label E
50
Label A+
7
Label A++
7
Label A++++
2
Label A+++
1
Label A+++++
0
| Year | Gas (m3) | Electricity (kWh) |
|---|---|---|
| 2020 | 1.570 | 3.490 |
| 2021 | 1.760 | 3.540 |
| 2022 | 1.360 | 3.380 |
| 2023 | 1.110 | 3.230 |
| 2024 | 1.090 | 3.310 |
Hoekwoning
Gas: 900 • Electricity: 2.650
Huurwoning
Gas: 820 • Electricity: 2.300
Koopwoning
Gas: 1.190 • Electricity: 3.460
Appartement
Gas: 750 • Electricity: 1.930
Tussenwoning
Gas: 860 • Electricity: 2.470
Vrijstaande woning
Gas: 1.340 • Electricity: 3.850
Twee-onder-één-kap woning
Gas: 1.020 • Electricity: 3.110
Total number of company establishments: 275
| Period | Crimes |
|---|---|
| jan 2025 | 1 |
| jan 2026 | 2 |
| jul 2025 | 2 |
| jun 2025 | 8 |
| mei 2025 | 3 |
| mrt 2025 | 2 |
| nov 2024 | 5 |
| nov 2025 | 7 |
| okt 2024 | 8 |
| okt 2025 | 7 |
| sep 2024 | 5 |
| sep 2025 | 5 |
These figures give an indicative picture of safety trends in the living environment of Beesel.
Short answers based on current local statistics, handy for a quick comparison of the living environment.
Beesel telt in 2025 ongeveer 2.430 inwoners.
De gemiddelde WOZ-waarde in Beesel is in 2025 circa € 390.000.
Het gemiddelde inkomen per inwoner in Beesel ligt rond € 34.000 per jaar.
Voor het huidige jaar gaat het om ongeveer 58 geregistreerde misdrijven. Gebruik deze cijfers als indicatie en vergelijk trends per periode.
In Beesel komt vooral "Vrijstaande woningen" veel voor, met ongeveer 535 woningen.