
Residents
12.265
Last year: 2025
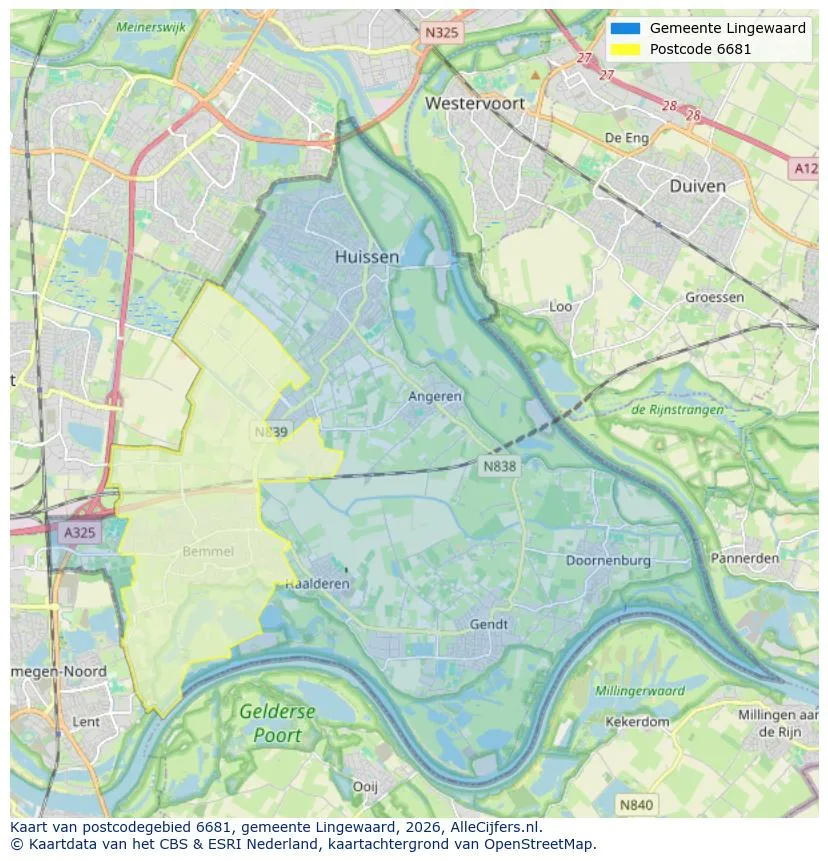
6681HJ Bemmel • Gelderland

For this property, no detailed description is available yet.
€ 498.000
Cost of copper (estimated): € 11.810
2% transfer tax (€ 9.960) + notary (€ 1.150) + valuation (€ 700)
Total purchase (incl. p.p.): € 509.810
3,04%
Yearly
€ 24.900
Direct available
Estimated mortgage
Indicative gross monthly cost
Based on annuity and 30 year term
Indicative net monthly cost
iDisclaimer: this mortgage calculation is a simplified indication based on general assumptions. No rights can be derived from the results shown. Calculated with 10-annual interest (zonder NHG), automatically determined based on the price limit € 470.000. Source: 10-jaars rente uit mortgage_rates (23-04-2026 08:38). For non-NHG, an 80% mortgage of the market value has been used in this indication.
Explore Bemmel and the surrounding areas
View current location data on residents, WOZ development, housing stock, energy consumption, business activity and safety in Bemmel. In 2025 were there 12.265 residents. The average WOZ value in 2025 is EUR 429.000.
Residents
12.265
Last year: 2025
Average WOZ
EUR 429.000
Last year: 2025
Average income per person.
EUR 36.300
Source: AllNumbers
Crimes (current year)
256
Total registered
| Year | Residents |
|---|---|
| 2021 | 12.206 |
| 2022 | 12.205 |
| 2023 | 12.325 |
| 2024 | 12.260 |
| 2025 | 12.265 |
| Year | Average WOZ |
|---|---|
| 2021 | EUR 309.000 |
| 2022 | EUR 345.000 |
| 2023 | EUR 394.000 |
| 2024 | EUR 414.000 |
| 2025 | EUR 429.000 |
Hoger
3.080
Praktisch
2.300
Middelbaar
3.710
Europa
670
Nederland
10.775
Buiten Europa
815
Label A
1.549
Label B
1.254
Label C
1.135
Label D
415
Label F
284
Label G
205
Label E
117
Label A+
99
Label A+++
91
Label A++
49
Label A++++
9
Label A+++++
3
| Year | Gas (m3) | Electricity (kWh) |
|---|---|---|
| 2020 | 1.340 | 3.200 |
| 2021 | 1.520 | 3.220 |
| 2022 | 1.130 | 2.860 |
| 2023 | 910 | 2.740 |
| 2024 | 900 | 2.880 |
Hoekwoning
Gas: 880 • Electricity: 2.600
Huurwoning
Gas: 690 • Electricity: 1.780
Koopwoning
Gas: 990 • Electricity: 3.070
Appartement
Gas: 620 • Electricity: 1.710
Tussenwoning
Gas: 800 • Electricity: 2.520
Vrijstaande woning
Gas: 1.300 • Electricity: 3.870
Twee-onder-één-kap woning
Gas: 1.070 • Electricity: 3.210
Total number of company establishments: 1.475
| Period | Crimes |
|---|---|
| jan 2025 | 15 |
| jan 2026 | 23 |
| jul 2025 | 14 |
| jun 2025 | 27 |
| mei 2025 | 17 |
| mrt 2025 | 14 |
| nov 2024 | 20 |
| nov 2025 | 25 |
| okt 2024 | 19 |
| okt 2025 | 30 |
| sep 2024 | 18 |
| sep 2025 | 26 |
These figures give an indicative picture of safety trends in the living environment of Bemmel.
Short answers based on current local statistics, handy for a quick comparison of the living environment.
Bemmel telt in 2025 ongeveer 12.265 inwoners.
De gemiddelde WOZ-waarde in Bemmel is in 2025 circa € 429.000.
Het gemiddelde inkomen per inwoner in Bemmel ligt rond € 36.300 per jaar.
Voor het huidige jaar gaat het om ongeveer 256 geregistreerde misdrijven. Gebruik deze cijfers als indicatie en vergelijk trends per periode.
In Bemmel komt vooral "Tussenwoningen" veel voor, met ongeveer 1.731 woningen.
View more homes in this location.

6681BP Bemmel
€ 595.000 k.k.

6681GC Bemmel
€ 385.000 k.k.

6681BT Bemmel
€ 750.000 k.k.

6681ZD Bemmel
€ 449.000 k.k.

6681TN Bemmel
€ 529.000 k.k.

6681NH Bemmel
€ 645.000 k.k.
€ 3.981/m²

6681AX Bemmel
€ 398.000 k.k.
€ 4.103/m²
6681MA Bemmel
€ 545.000 k.k.
€ 4.291/m²
