Residents
31.694
Last year: 2026
5683NX Best • Noord-Brabant
€ 550.000 k.k.
Cost of copper (estimated): € 12.850
2% transfer tax (€ 11.000) + notary (€ 1.150) + valuation (€ 700)
Total incl. VAT: € 562.850
Purchase price /m²: € 3.986
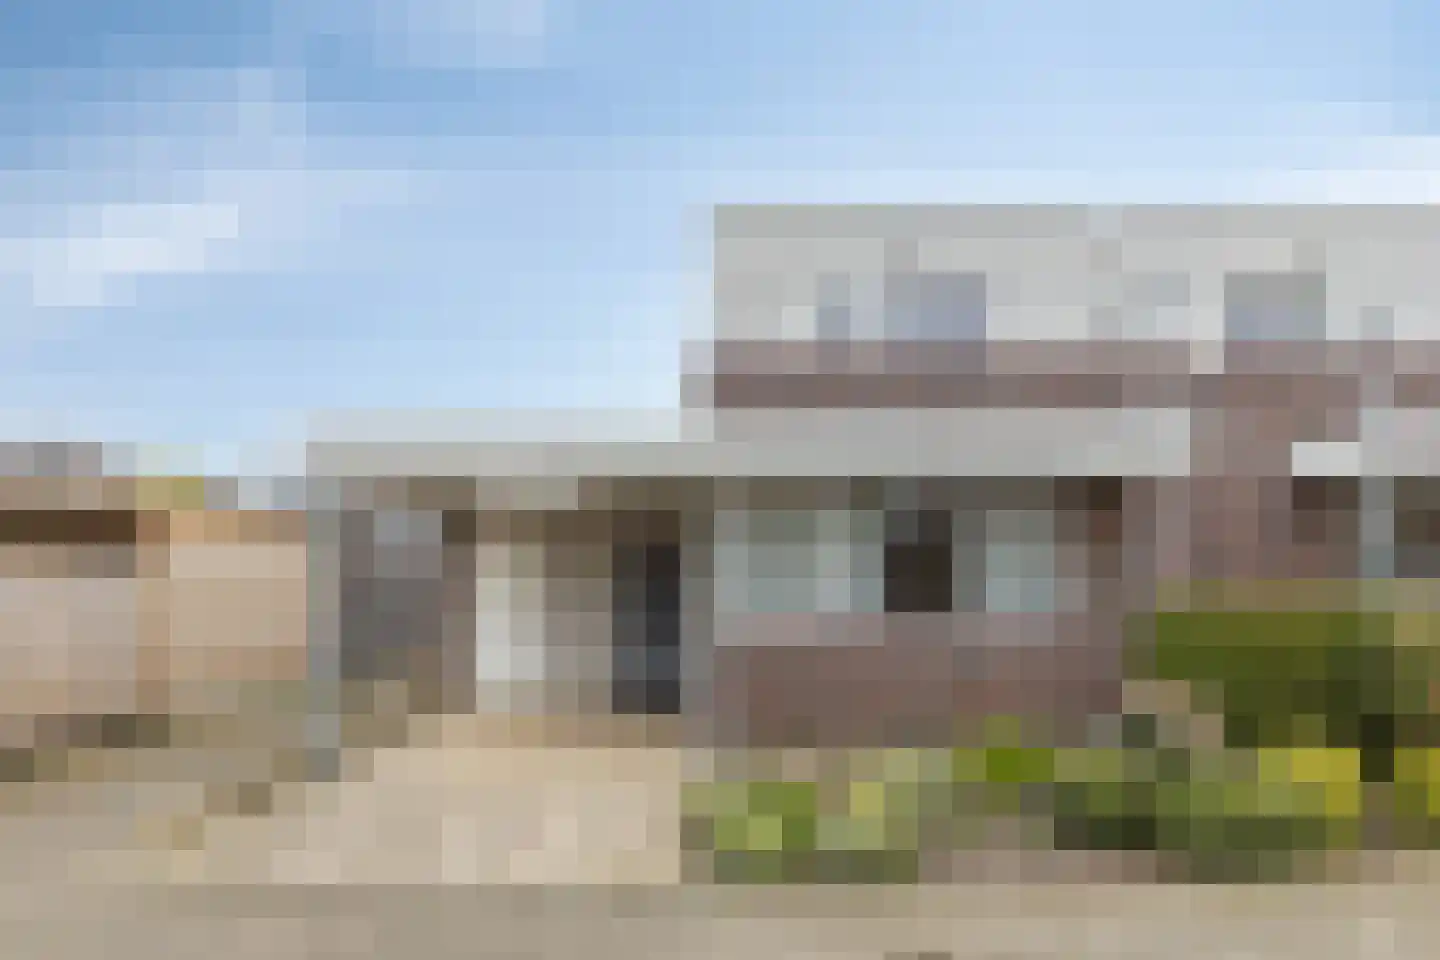
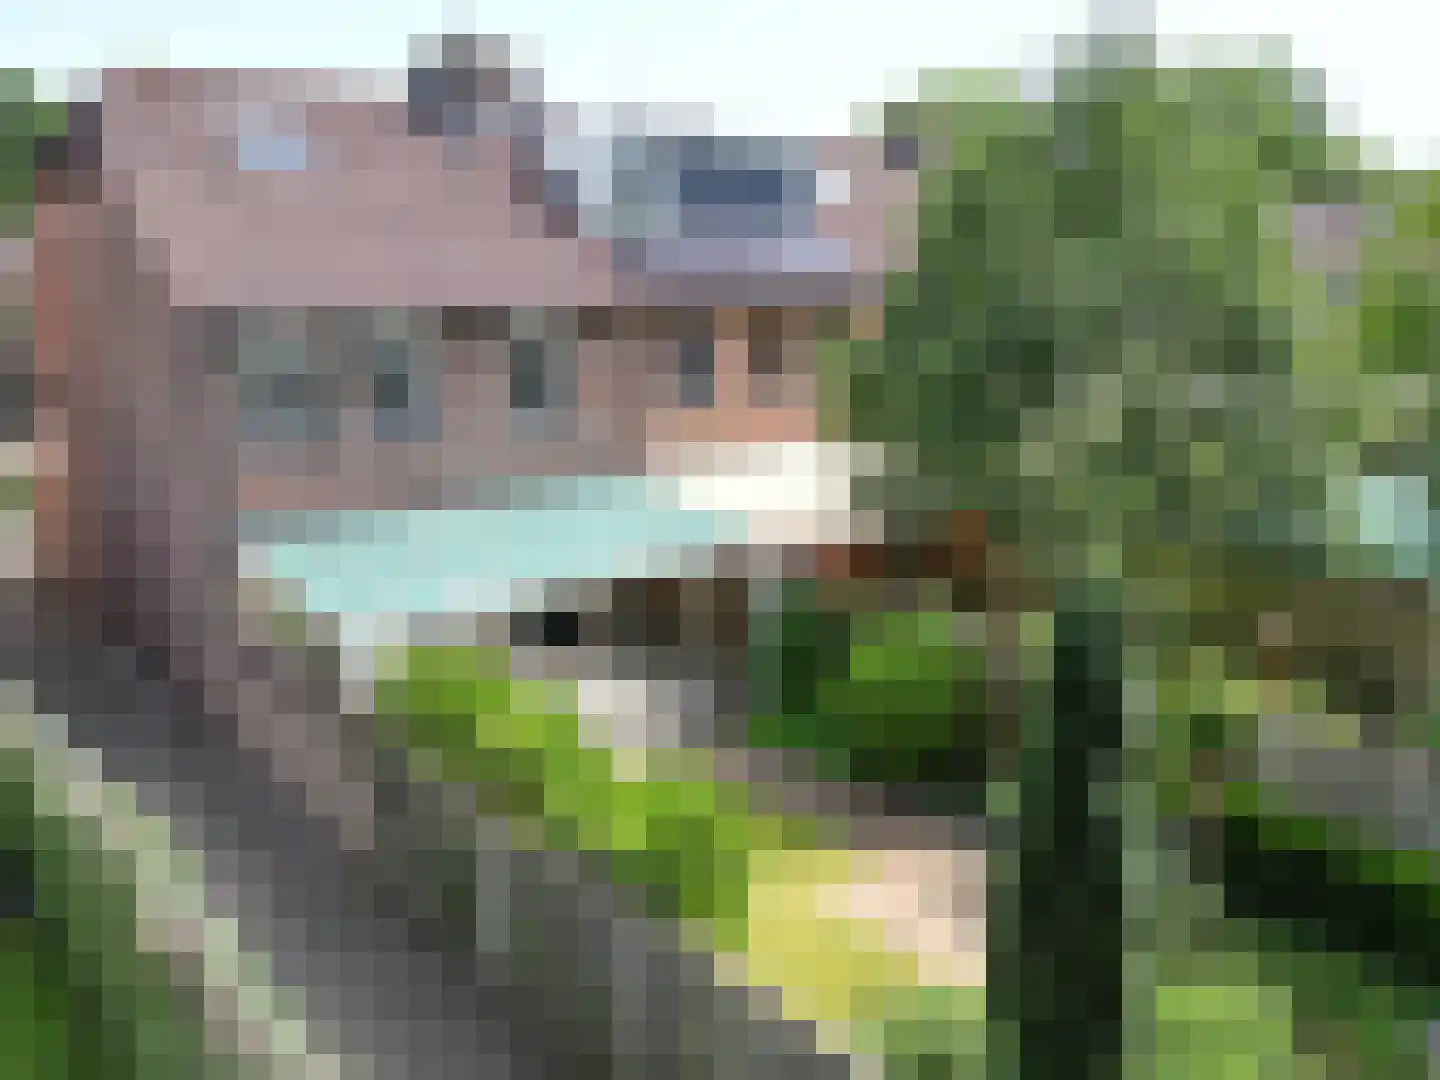
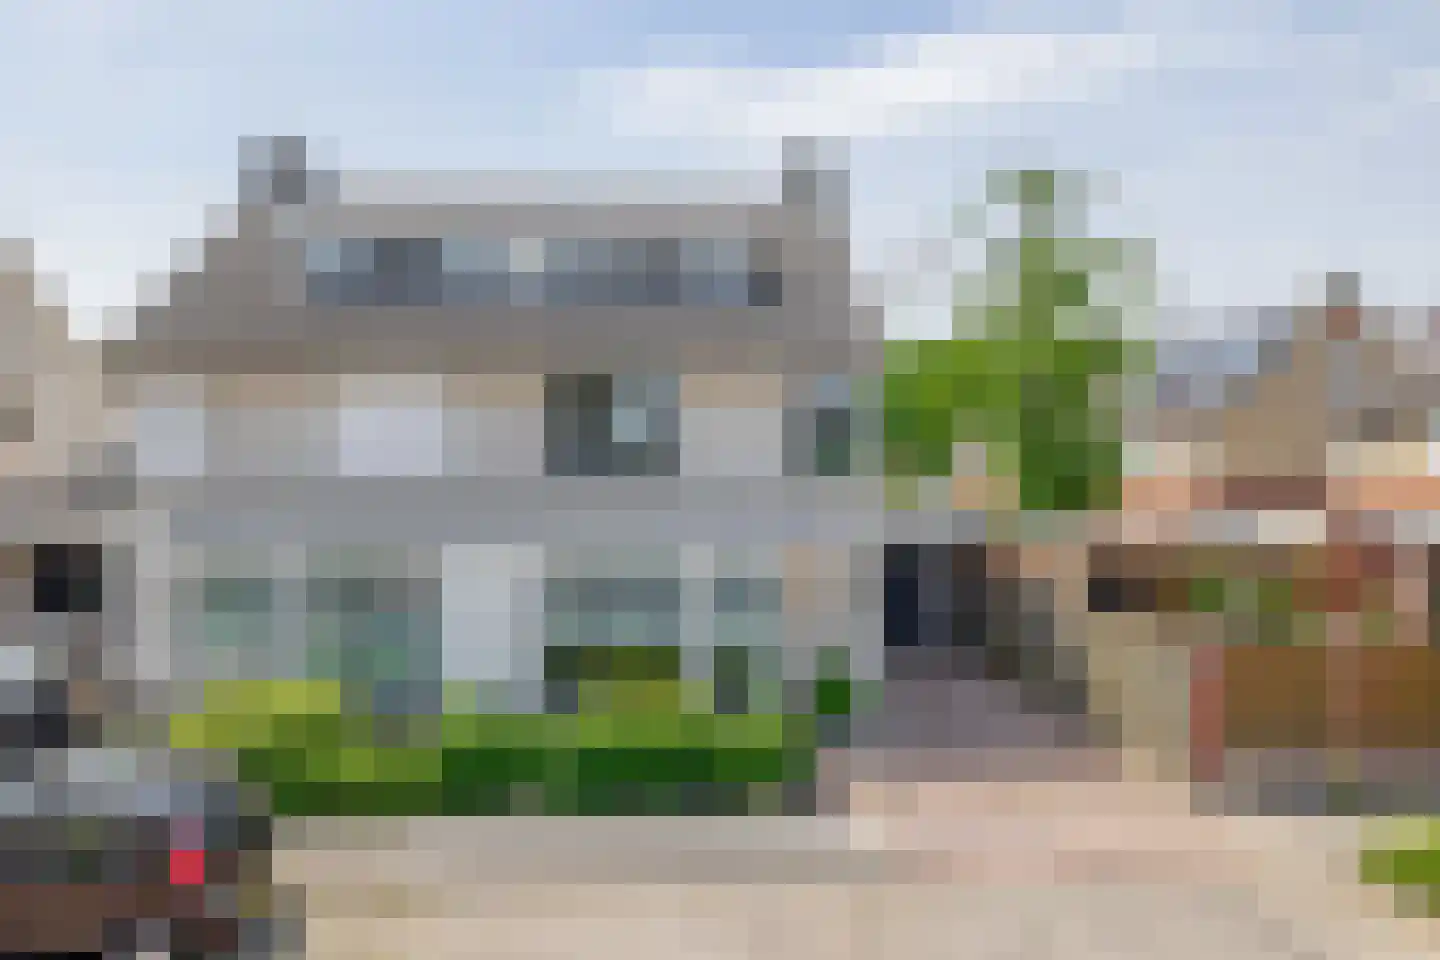
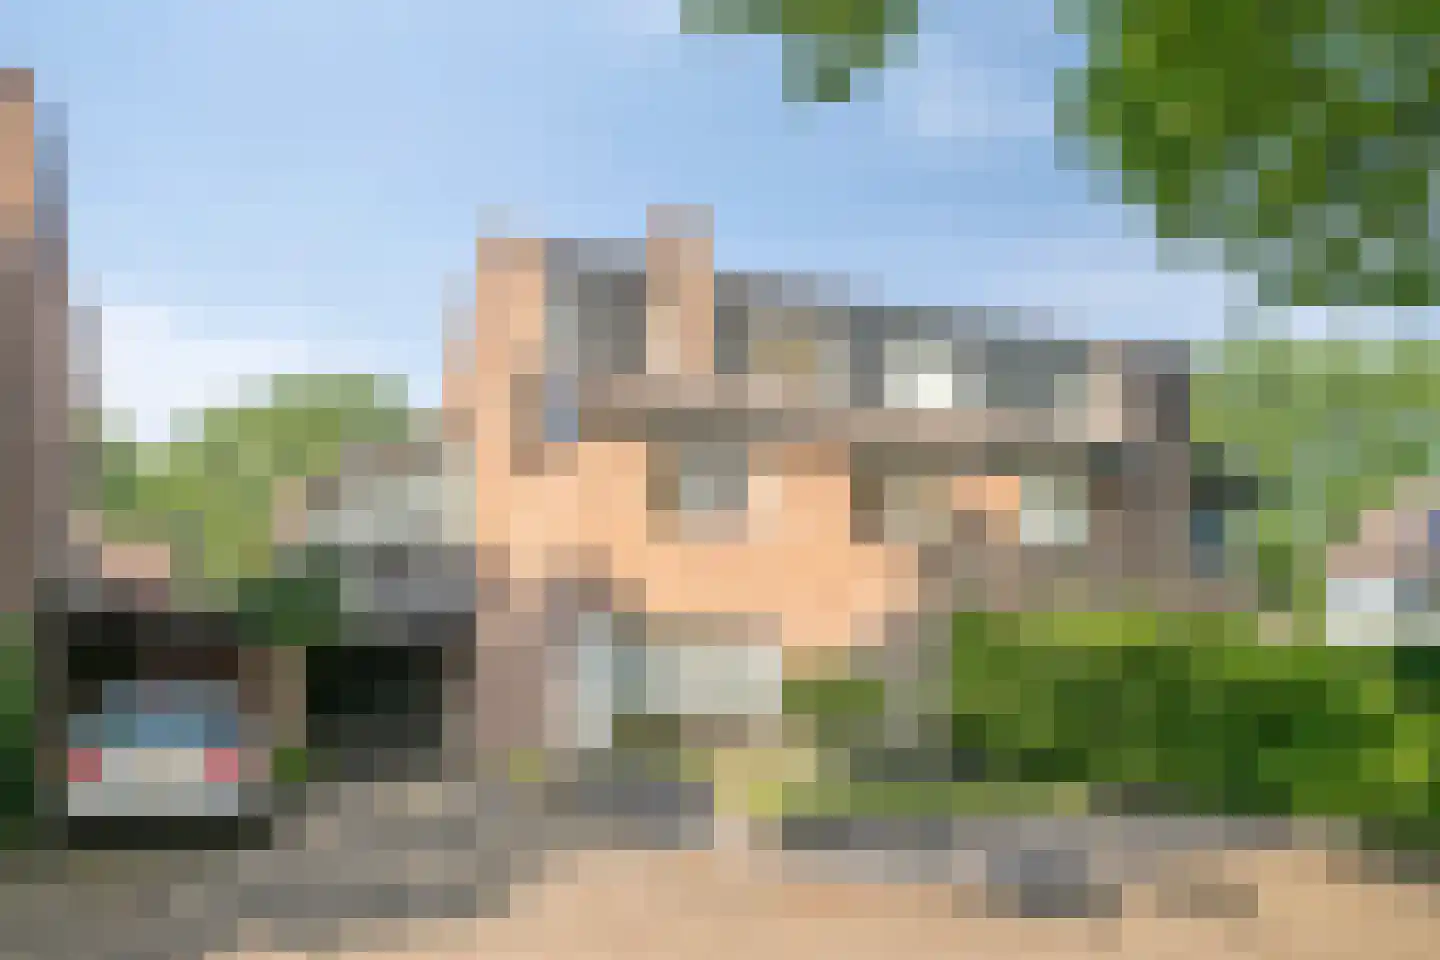
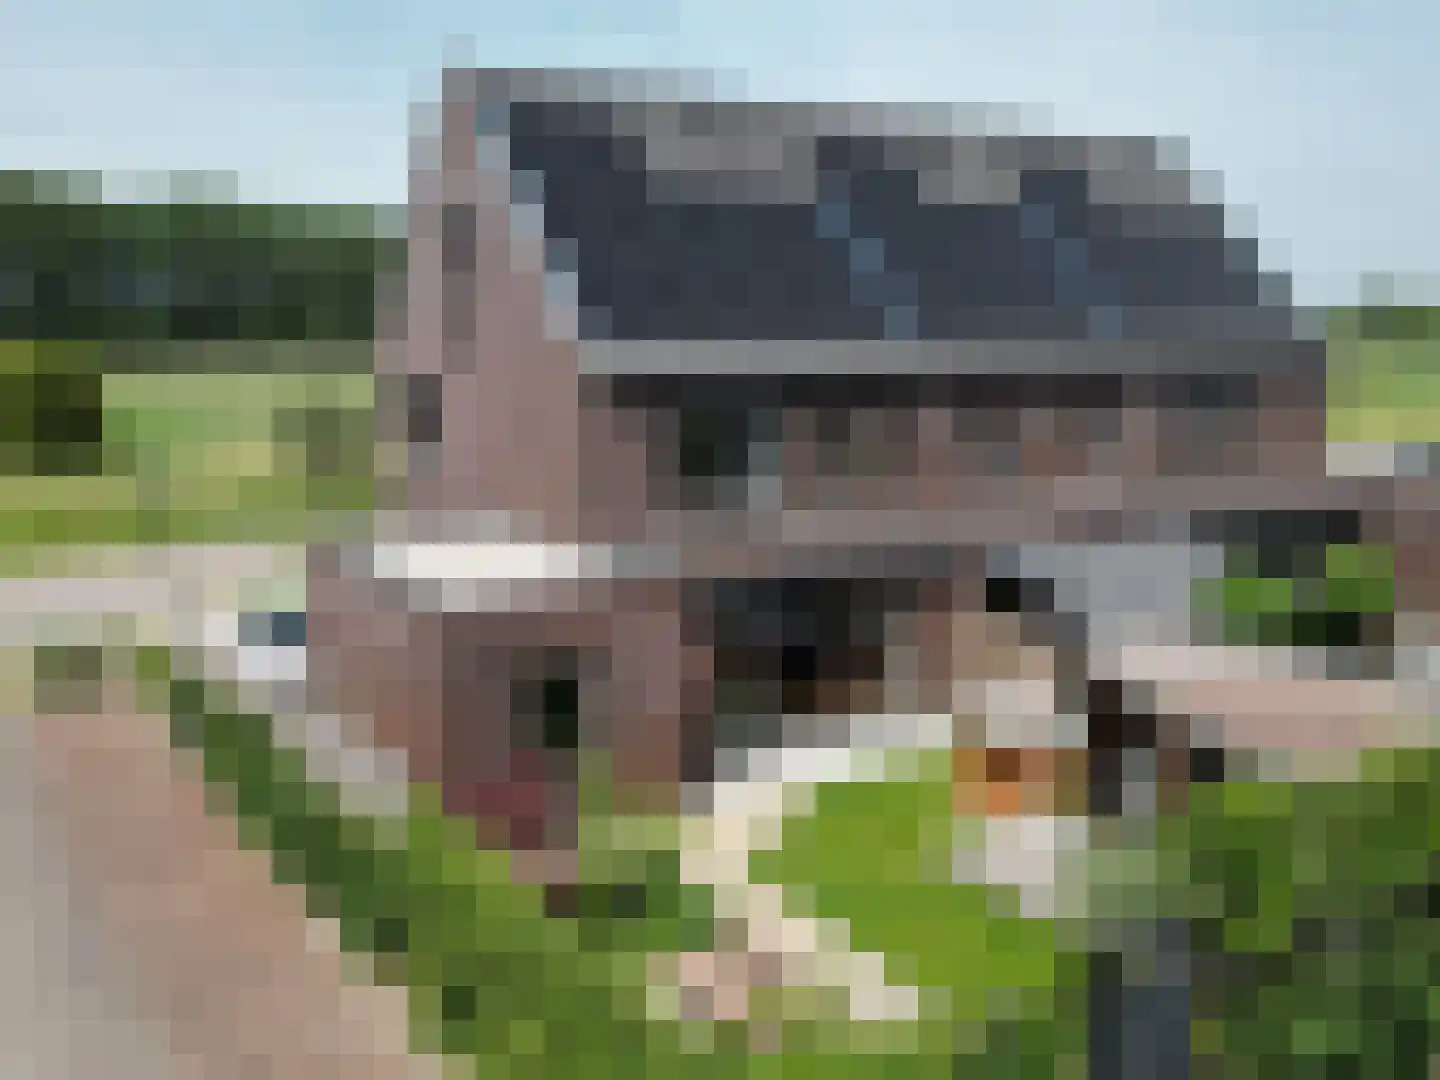
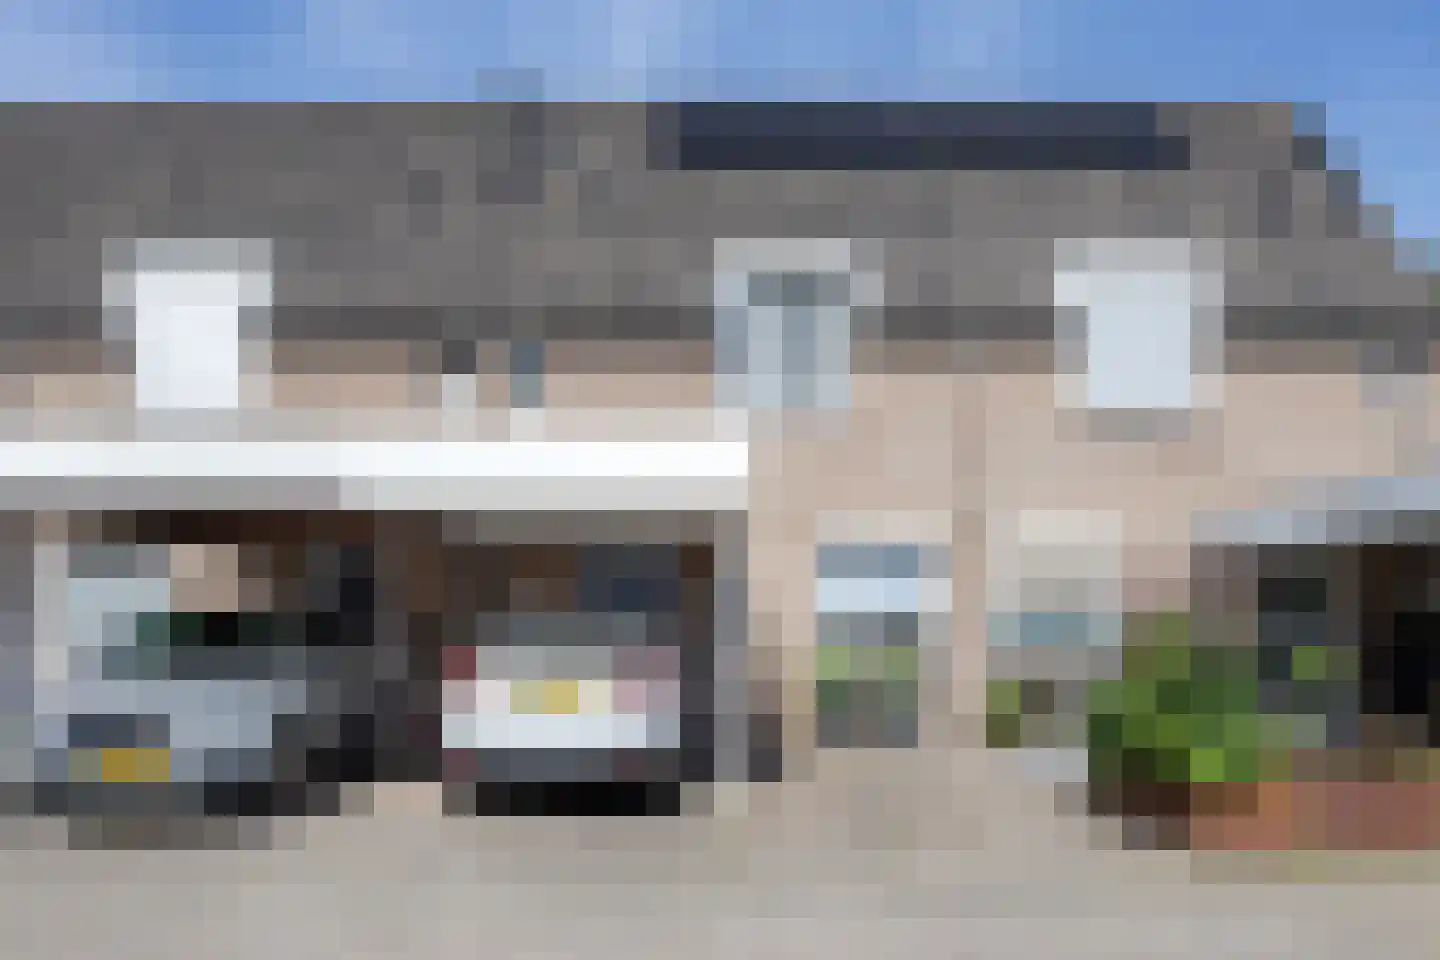
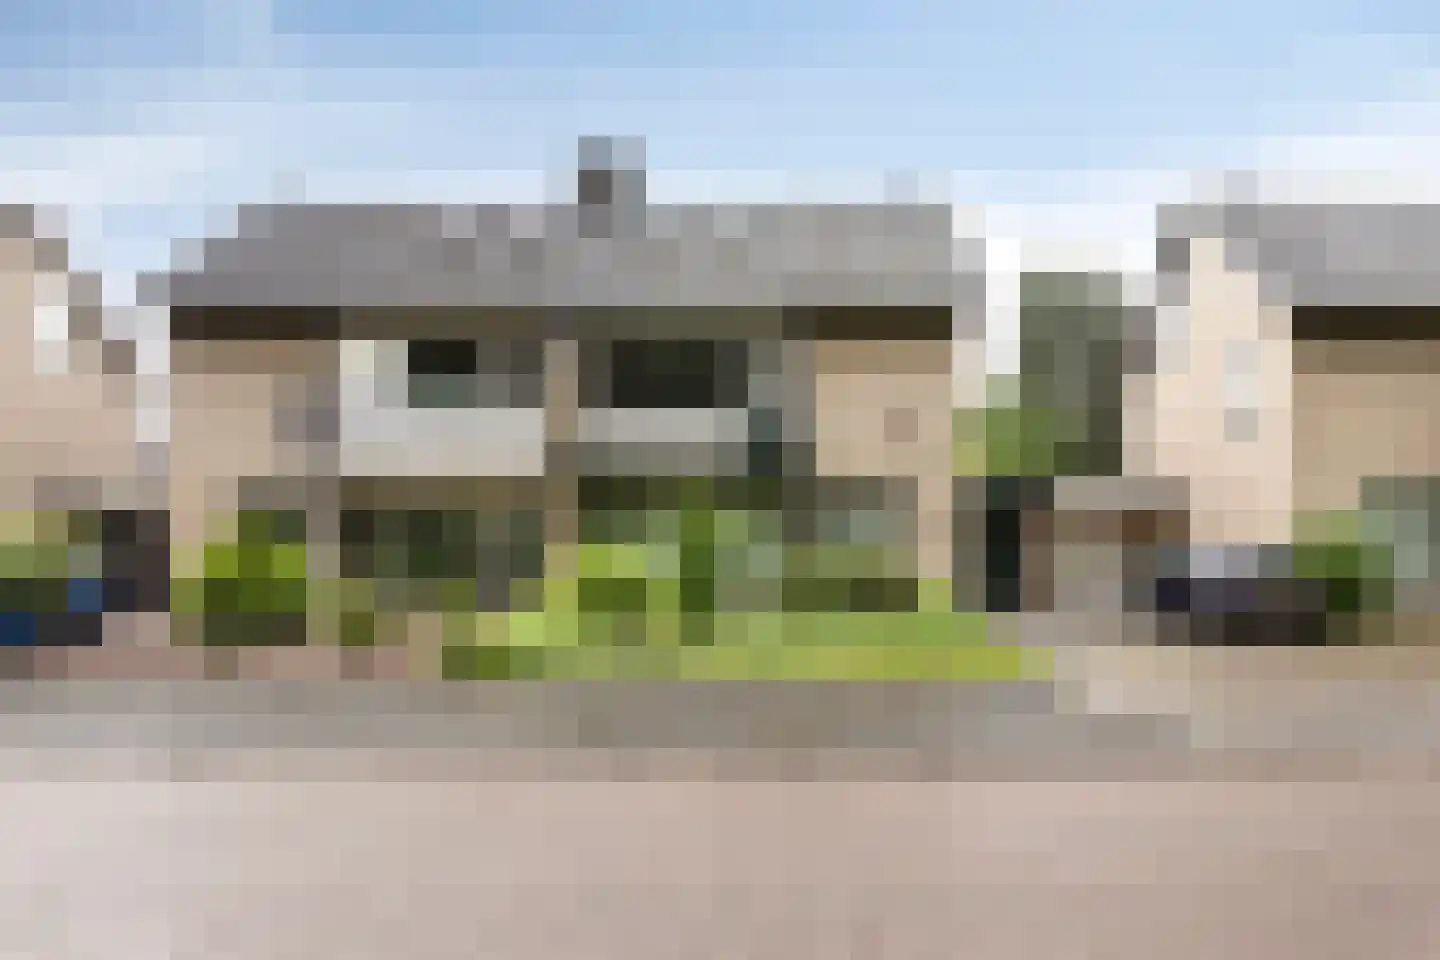
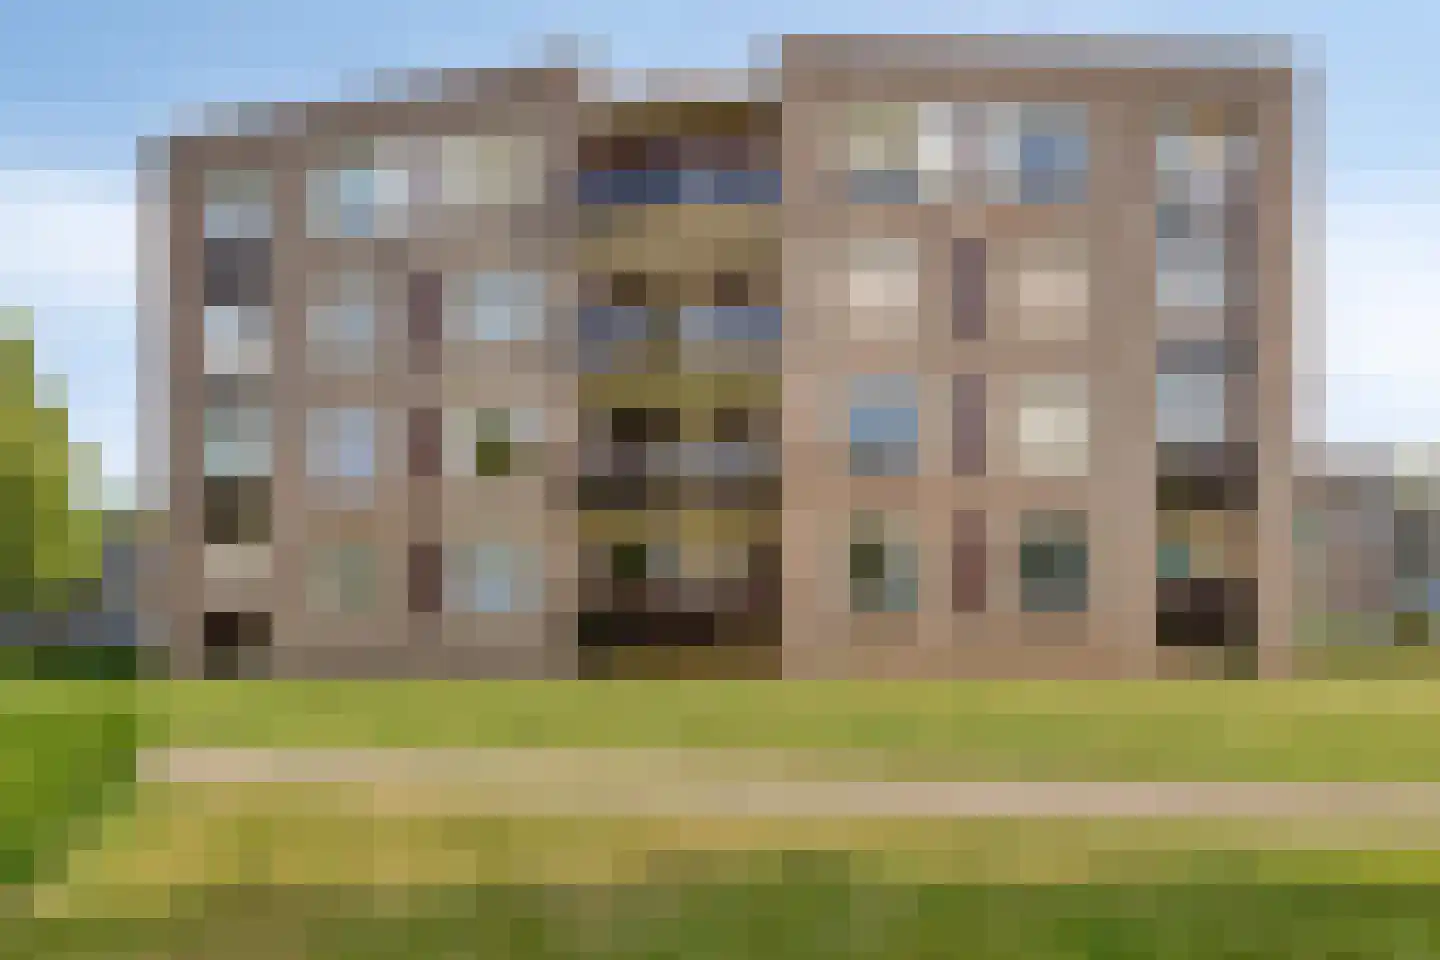
Speldenmaker 23a te Best biedt het beste van comfortabel en levensloopbestendig wonen in een rustige, prettige woonomgeving. Deze semi-bungalow beschikt over een royale slaapkamer en een complete badkamer op de begane grond, waardoor alle dagelijkse voorzieningen gelijkvloers aanwezig zijn (slapen, wassen en douchen). Ideaal voor wie toekomstgericht wil wonen. Op de verdieping bevinden zich nog twee slaapkamers en een extra douche, perfect voor logés of een gezin. De woning beschikt over parkeergelegenheid op eigen terrein met een carport. De ligging is bijzonder aantrekkelijk: in een zeer rustige buurt en toch op loopafstand van het centrum van Best. De achtertuin is gesitueerd op het oosten, waardoor u ’s ochtends heerlijk van de zon geniet. Daarnaast beschikt de woning over een dakterras op de eerste verdieping op het westen, ideaal voor de middag- en avondzon. Kortom, een comfortabele en veelzijdige woning op een fijne locatie! Begane grond: De begane grond is praktisch en comfortabel ingedeeld, met alle voorzieningen binnen handbereik. U komt binnen via een overdekte entree, met een carport en oprit voor de auto. Via de oprit is tevens de inpandige berging bereikbaar, ideaal voor extra opslag of het stallen van fietsen. De hal is voorzien van een tegelvloer en biedt toegang tot de meterkast, trapopgang, woonkamer, toiletruimte en berging/wasruimte. Deze berging is uitgerust met een cv-ketel (Intergas HR), unit voor mechanische ventilatie en aansluitingen voor de wasmachine. De deels betegelde toiletruimte beschikt over een wandtoilet en fonteintje. De royale woonkamer aan de achterzijde is afgewerkt met een laminaatvloer en biedt via een schuifpui direct toegang tot de achtertuin. Aan de voorzijde bevindt zich de lichte keuken met een hoekopstelling, voorzien van diverse inbouwapparatuur zoals een vaatwasser, dubbele spoelbak, boiler, gaskookplaat, afzuigkap, oven en koel-/vriescombinatie. Tevens is er volop ruimte voor het plaatsen van een eettafel. Vanuit de woonkamer bereikt u de ruime slaapkamer op de begane grond, voorzien van een laminaatvloer, een royale inbouwkast en grote raampartijen met een deur naar de achtertuin. Aansluitend bevindt zich de volledig betegelde badkamer met een inloopdouche (met glazen wand), wastafel, wandtoilet, kast en aansluiting voor de wasmachine. Verdieping: De verdieping is praktisch ingedeeld en biedt volop extra ruimte. Via de overloop heeft u toegang tot twee slaapkamers, een separate toiletruimte en een doucheruimte. Aan de achterzijde bevindt zich een ruime slaapkamer, ideaal als logeer- of werkkamer. De deels betegelde toiletruimte is voorzien van een wandtoilet. Daarnaast is er een volledig betegelde doucheruimte met douche en wastafel. De slaapkamer aan de voorzijde biedt toegang tot het dakterras, gelegen op het westen, waar u heerlijk kunt genieten van de middag- en avondzon. Buitenruimte: De voortuin is netjes aangelegd met diverse beplanting, wat zorgt voor een verzorgde en groene uitstraling bij aankomst. De achtertuin is volledig betegeld en daarmee onderhoudsvriendelijk ingericht, ideaal om zonder veel onderhoud van de buitenruimte te genieten. Bijzonderheden: -Glasvezelaansluiting aanwezig -Boiler voor warm water in de keuken -Elektrisch bedienbaar zonneluifel aan de woonkamerzijde -Rolstoeltoegankelijk en geschikt voor minder-validen (volledig woonprogramma op de begane grond) -Gelegen op loopafstand van het centrum van Best -Rustige ligging in een doodlopende straat in de wijk ‘De Leeuwerik’ -Niet-bewonersclausule zal worden opgenomen in de koopovereenkomst Algemene informatie - Wij doen er alles aan je zo goed mogelijk te informeren. De verkoopbrochure en plattegronden zijn slechts indicatief. Er kunnen geen rechten aan worden ontleend. De lijst van zaken in de brochure geeft aan welke zaken bij de woning zijn inbegrepen. Als koper heeft u een onderzoeksplicht. In ons dossier is altijd een door de opdrachtgever ingevulde vragenlijst aanwezig. Om een compleet beeld van de woning te krijgen kun je deze lijst ter inzage krijgen. - Partijen zijn pas aan elkaar gebonden, niet eerder dan dat er een schriftelijke overeenkomst is gesloten. - De woning is ingemeten conform de branchebrede meetinstructie. De meetinstructie is bedoeld om een meer eenduidige manier van meten toe te passen voor het geven van een indicatie van de gebruiksoppervlakte. De Meetinstructie sluit verschillen in meetuitkomsten niet volledig uit, door bijvoorbeeld interpretatieverschillen, afrondingen of beperkingen bij het uitvoeren van de meting.
€ 550.000
Cost of copper (estimated): € 12.850
2% transfer tax (€ 11.000) + notary (€ 1.150) + valuation (€ 700)
Total purchase (incl. p.p.): € 562.850
3,21%
Yearly
€ 27.500
Direct available
Estimated mortgage
Indicative gross monthly cost
Based on annuity and 30 year term
Indicative net monthly cost
iDisclaimer: this mortgage calculation is a simplified indication based on general assumptions. No rights can be derived from the results shown. Calculated with 10-annual interest (zonder NHG), automatically determined based on the price limit € 470.000. Source: 10-jaars rente uit mortgage_rates (07-06-2026 03:45). For non-NHG, an 80% mortgage of the market value has been used in this indication.
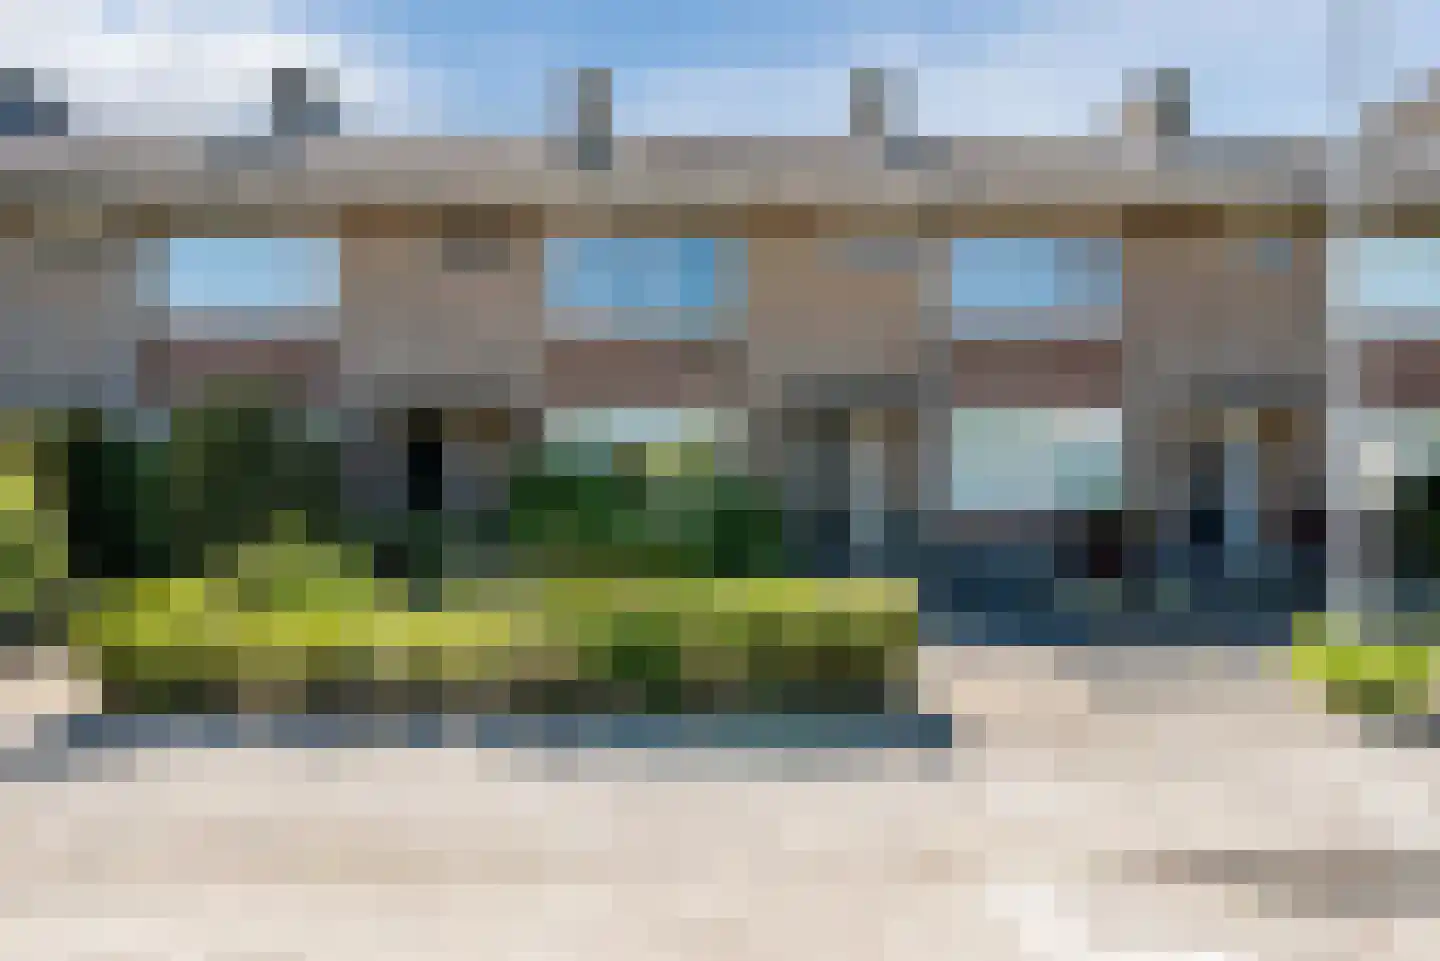
Inloopdouche, toilet, 2 wastafels, en douche
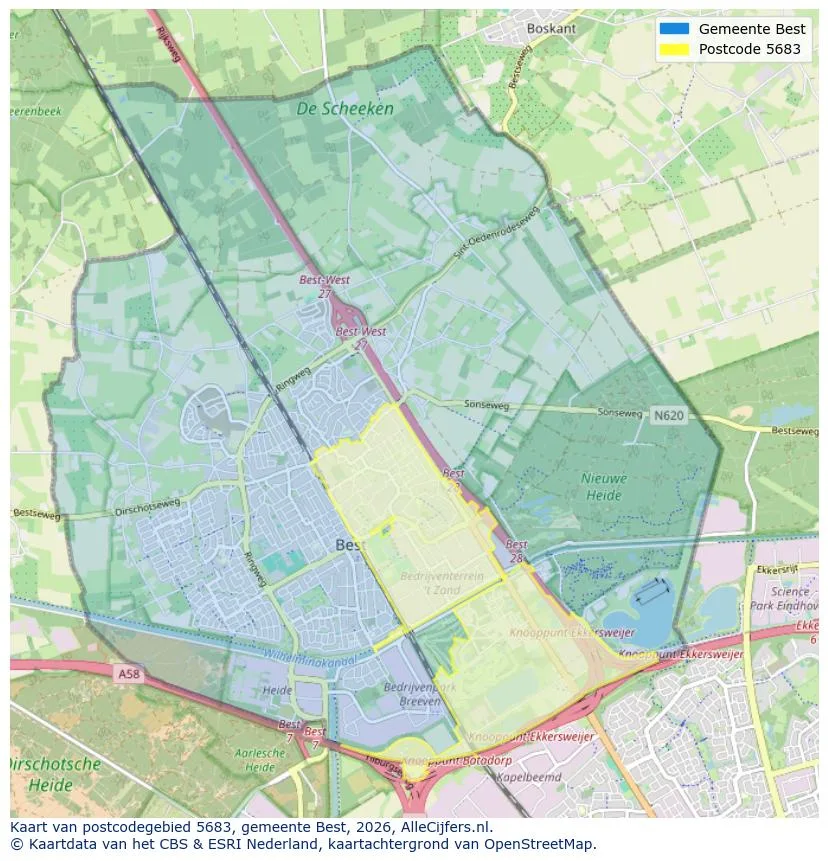
Discover where agents are active in Best
View current location data on residents, WOZ development, housing stock, energy consumption, business activity and safety in Best. In 2026 were there 31.694 residents. The average WOZ value in 2025 is EUR 464.000.
Residents
31.694
Last year: 2026
Average WOZ
EUR 464.000
Last year: 2025
Average income per person.
EUR 37.200
Source: AllNumbers
Crimes (current year)
1.240
Total registered
| Year | Residents |
|---|---|
| 2022 | 30.608 |
| 2023 | 30.897 |
| 2024 | 31.223 |
| 2025 | 31.652 |
| 2026 | 31.694 |
| Year | Average WOZ |
|---|---|
| 2021 | EUR 321.000 |
| 2022 | EUR 359.000 |
| 2023 | EUR 403.000 |
| 2024 | EUR 431.000 |
| 2025 | EUR 464.000 |
Hoger
38
Praktisch
22
Middelbaar
39
Europa
2.888
Nederland
24.386
Buiten Europa
4.378
Label A
3.807
Label C
3.631
Label B
3.027
Label D
852
Label E
828
Label F
606
Label A+++
585
Label A++++
481
Label G
349
Label A+
274
Label A++
118
Label A+++++
5
| Year | Gas (m3) | Electricity (kWh) |
|---|---|---|
| 2020 | 1.250 | 3.170 |
| 2021 | 1.370 | 3.200 |
| 2022 | 1.060 | 2.980 |
| 2023 | 890 | 2.840 |
| 2024 | 860 | 2.940 |
Hoekwoning
Gas: 940 • Electricity: 2.930
Huurwoning
Gas: 700 • Electricity: 2.140
Koopwoning
Gas: 970 • Electricity: 3.130
Appartement
Gas: 560 • Electricity: 1.870
Tussenwoning
Gas: 830 • Electricity: 2.690
Vrijstaande woning
Gas: 1.410 • Electricity: 4.350
Twee-onder-één-kap woning
Gas: 1.080 • Electricity: 3.330
Total number of company establishments: 4.005
| Period | Crimes |
|---|---|
| jan 2025 | 83 |
| jan 2026 | 120 |
| jul 2025 | 113 |
| jun 2025 | 111 |
| mei 2025 | 118 |
| mrt 2025 | 87 |
| nov 2024 | 100 |
| nov 2025 | 102 |
| okt 2024 | 94 |
| okt 2025 | 105 |
| sep 2024 | 89 |
| sep 2025 | 109 |
These figures give an indicative picture of safety trends in the living environment of Best.
Short answers based on current local statistics, handy for a quick comparison of the living environment.
Best telt in 2026 ongeveer 31.694 inwoners.
De gemiddelde WOZ-waarde in Best is in 2025 circa € 464.000.
Het gemiddelde inkomen per inwoner in Best ligt rond € 37.200 per jaar.
Voor het huidige jaar gaat het om ongeveer 1.240 geregistreerde misdrijven. Gebruik deze cijfers als indicatie en vergelijk trends per periode.
In Best komt vooral "Tussenwoningen" veel voor, met ongeveer 5.709 woningen.
View more homes in this location.
5683LK Best
€ 525.000 k.k.
€ 4.375/m²
5685JP Best
€ 669.000 k.k.
€ 4.316/m²
5683LW Best
€ 700.000 k.k.
€ 4.217/m²
5684MA Best
€ 689.000 k.k.
€ 4.785/m²
5684JC Best
€ 445.000 k.k.
€ 3.870/m²
5683KJ Best
€ 550.000 k.k.
€ 3.595/m²
5683DN Best
€ 450.000 k.k.
€ 5.488/m²
5683EP Best
€ 415.000 k.k.
€ 4.278/m²
