
Residents
40.915
Last year: 2025
1943DE Beverwijk • Noord-Holland
€ 765.000 k.k.
Cost of copper (estimated): € 17.150
2% transfer tax (€ 15.300) + notary (€ 1.150) + valuation (€ 700)
Total incl. VAT: € 782.150
Purchase price /m²: € 4.665
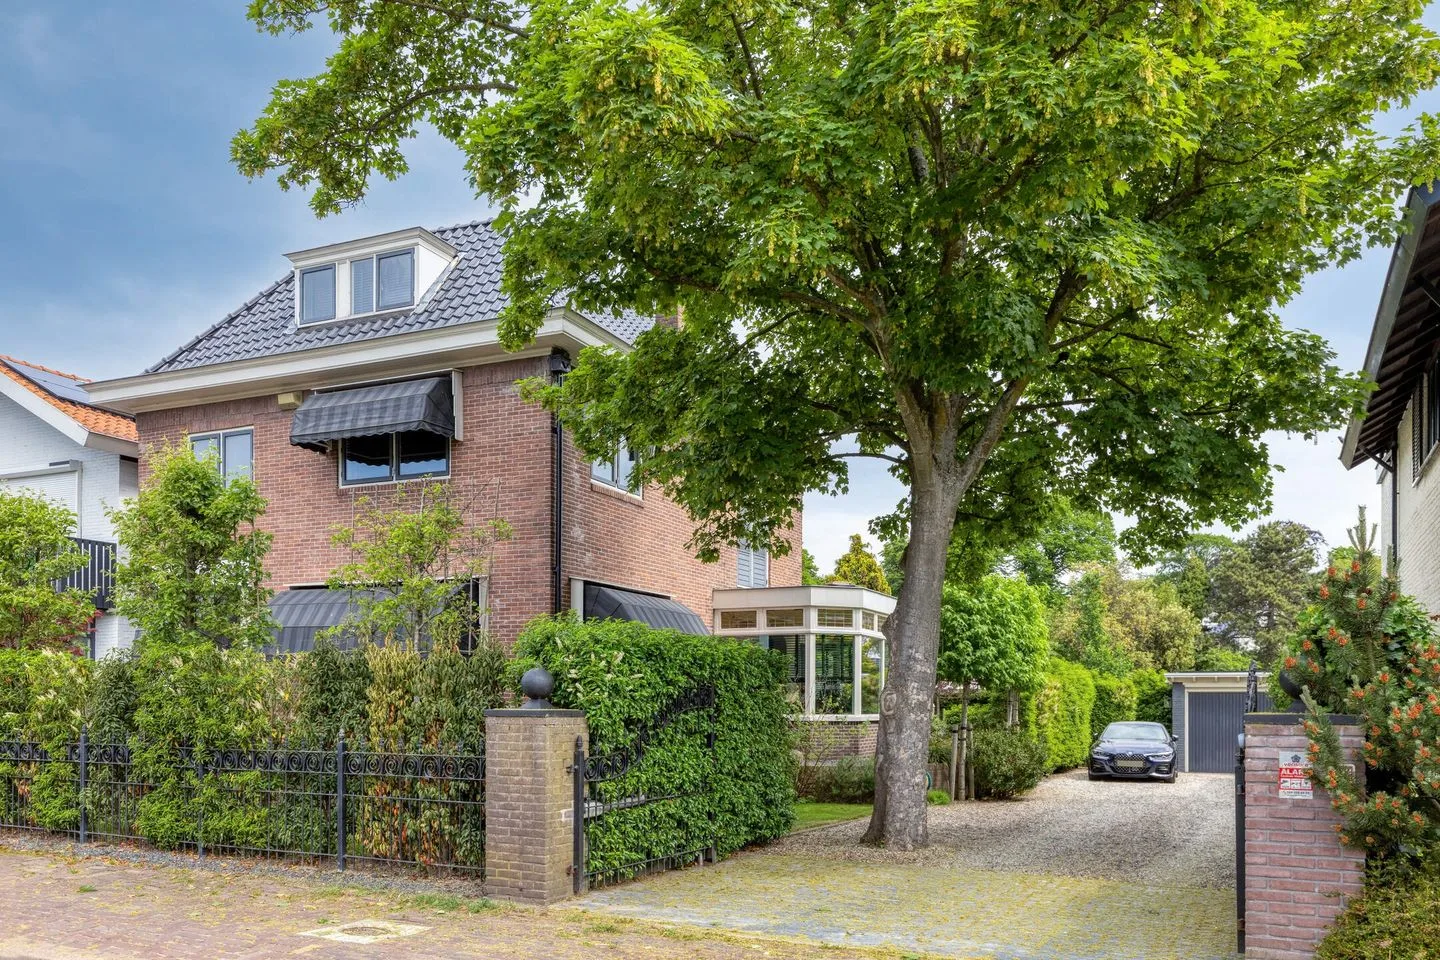
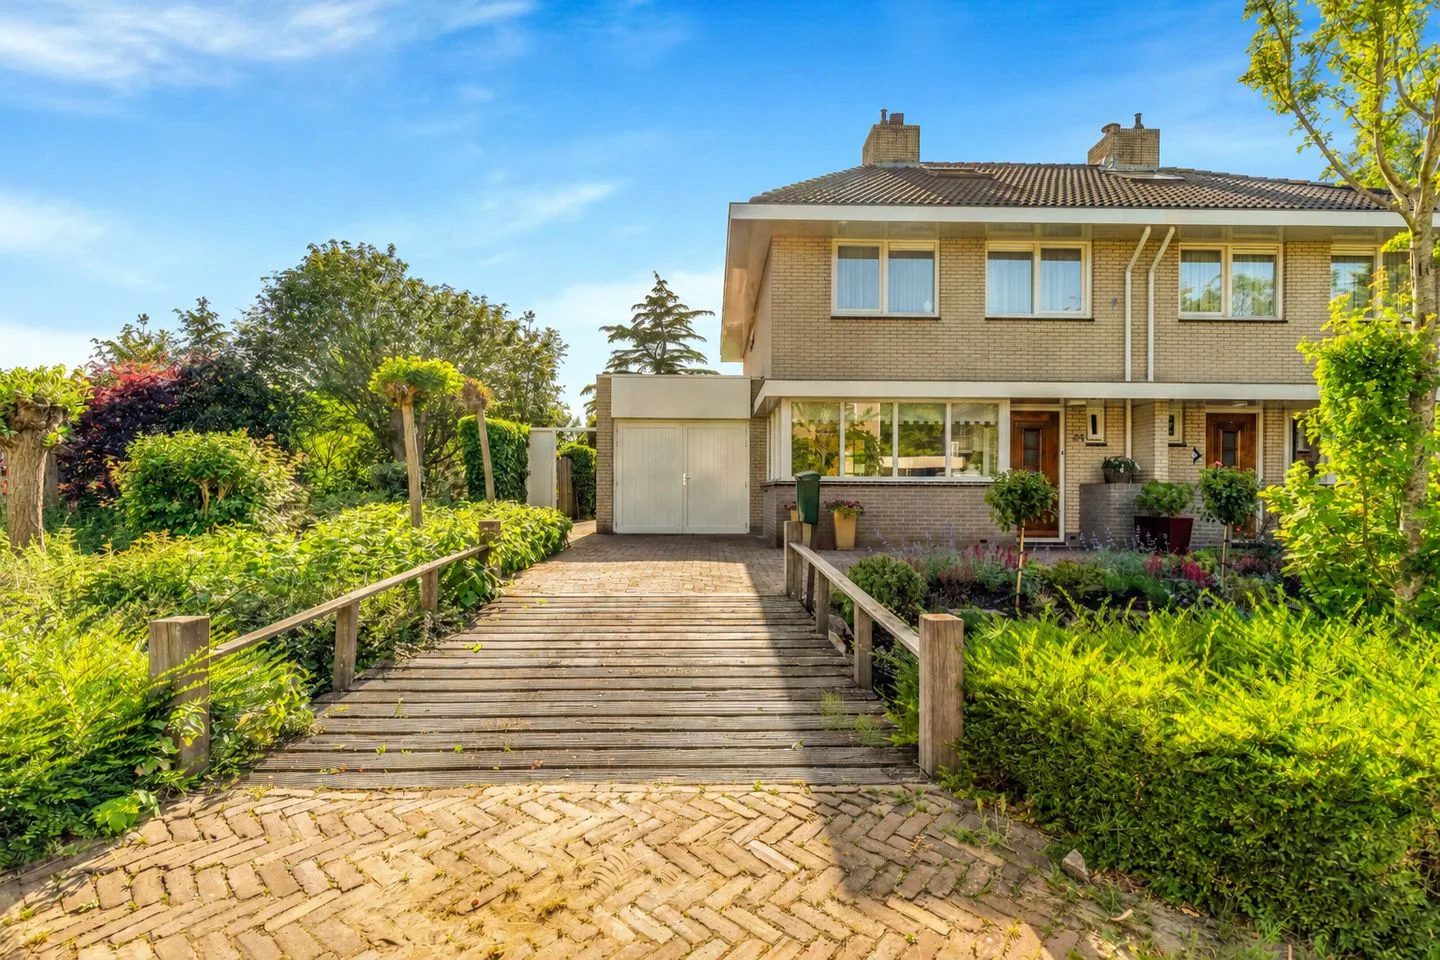
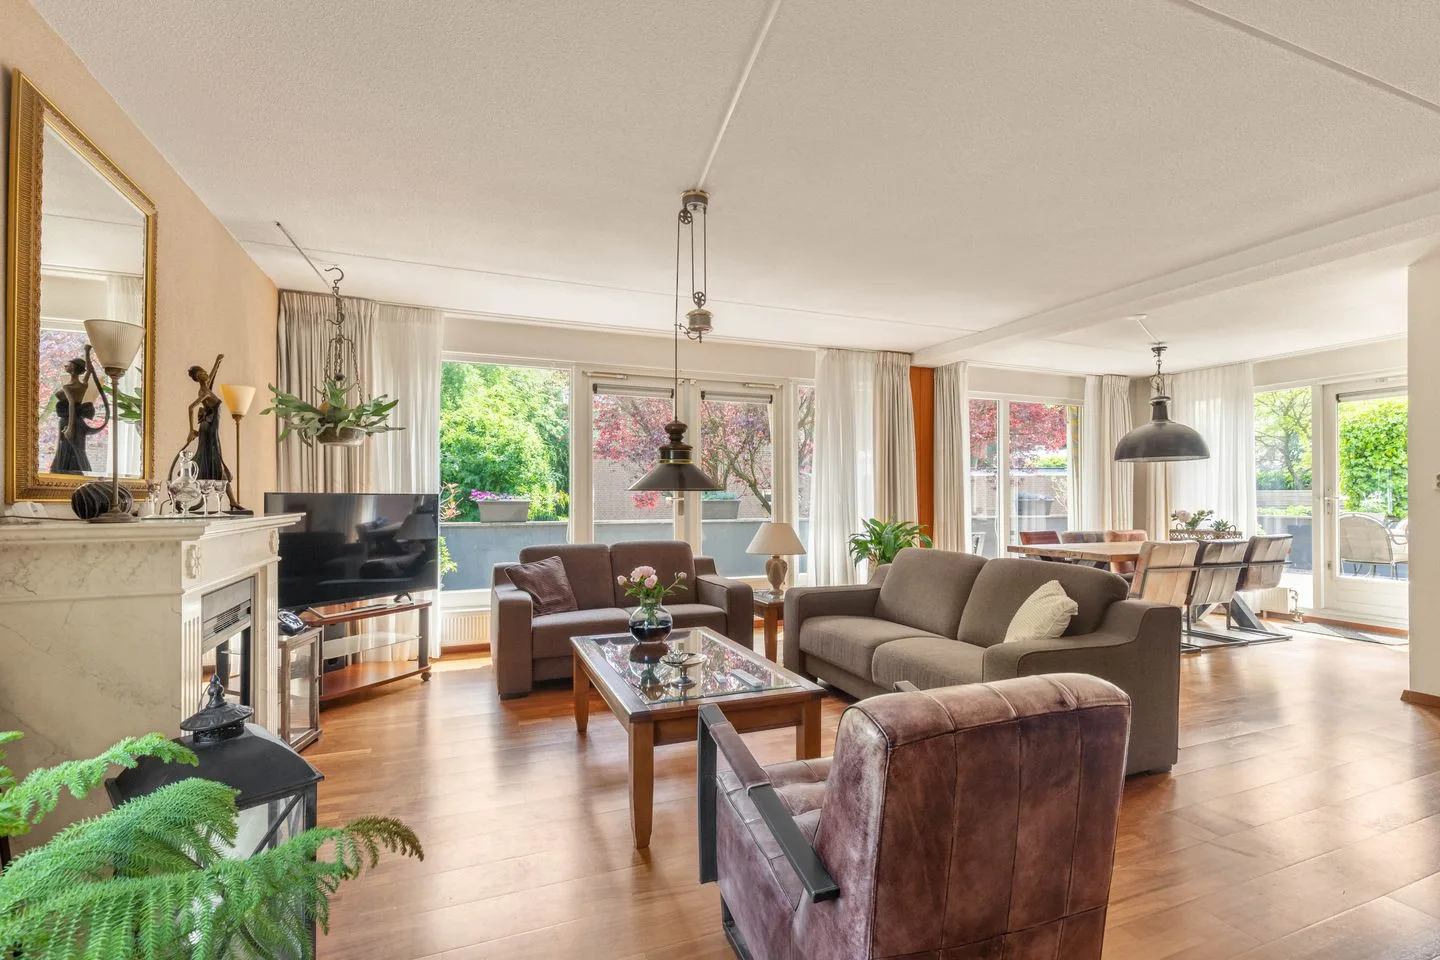
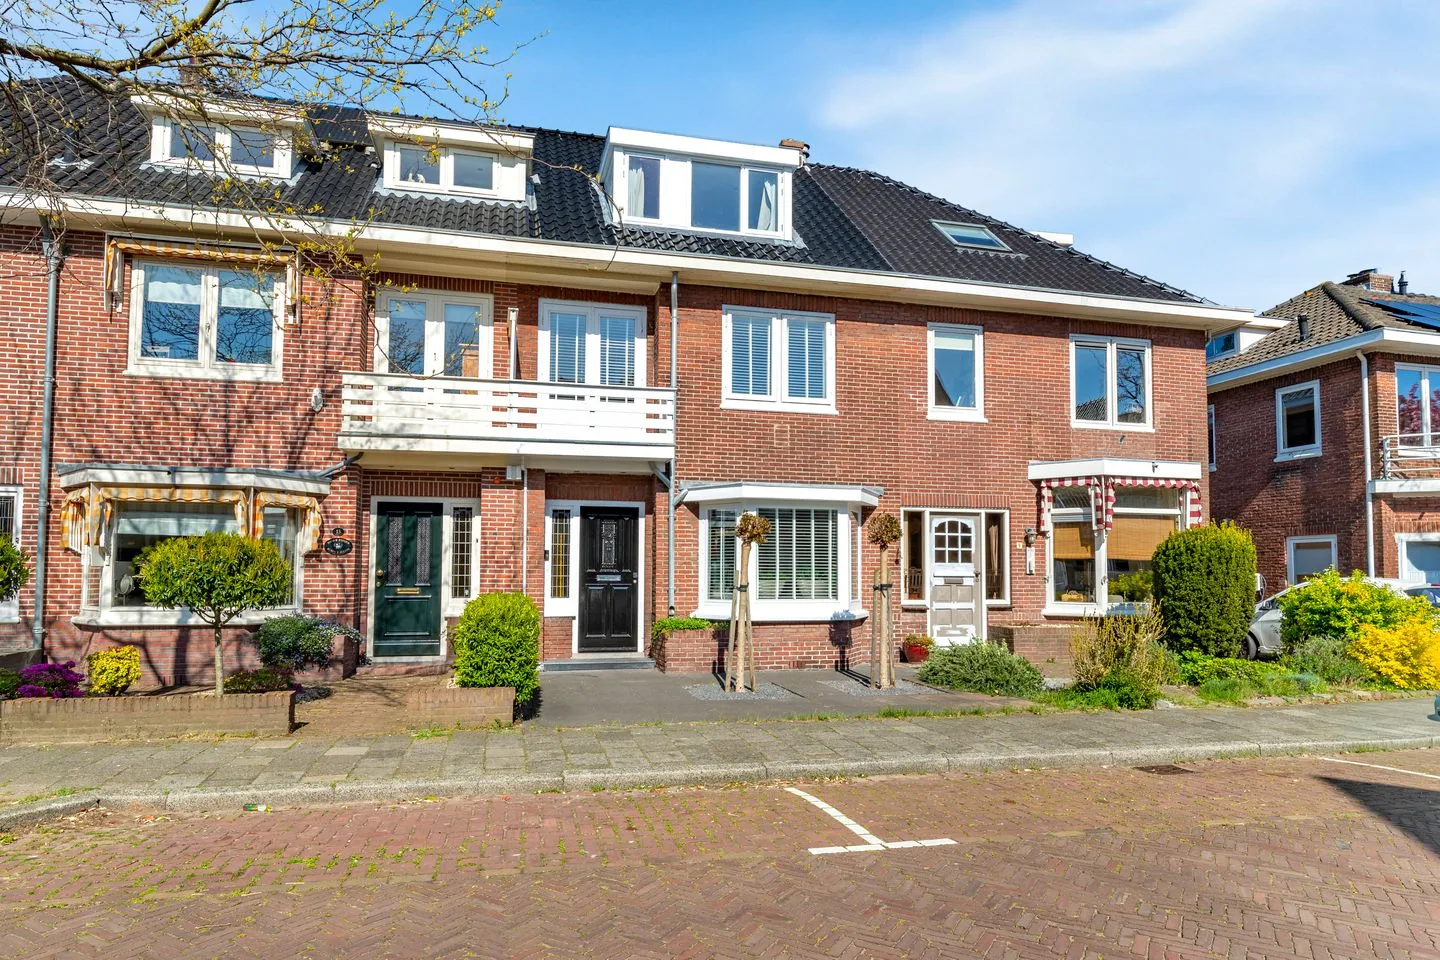
Aan een rustige, groene laan in een geliefde woonwijk van Beverwijk staat deze royale twee-onder-een-kapwoning die uitblinkt in ruimte, licht en mogelijkheden. Dreef 34 is zo’n huis waar je direct voelt hoeveel potentie er schuilt achter de gevel. Een solide woning met een fijne basis, een royale tuin en volop kansen om hier jouw eigen droomhuis van te maken. Of je nu houdt van modern, warm landelijk of tijdloos klassiek: dit huis biedt het perfecte canvas. Bouwjaar: 1964 Perceeloppervlakte: 425 m² Woonoppervlakte: ca. 164 m² Inhoud: ca. 532 m³ Energielabel: C Begane grond Via de ruime entree met garderobe en toilet betreed je de woning. De hal geeft direct toegang tot de royale woonkamer, een indrukwekkende leefruimte met grote raampartijen en een fijne lichtinval. De open haard vormt een sfeervol middelpunt en benadrukt het huiselijke karakter. Hier is meer dan genoeg ruimte voor een comfortabele zithoek én een grote eettafel, ideaal voor lange avonden met familie en vrienden. De indeling leent zich uitstekend voor het creëren van een moderne, open leefruimte, waarbij wonen, koken en eten naadloos in elkaar overlopen. De keuken is praktisch ingericht en biedt een uitstekende basis voor een eigentijdse upgrade naar een woonkeuken volledig naar eigen wens. Vanuit de keuken is er directe toegang tot de tuin, waardoor binnen en buiten op natuurlijke wijze met elkaar verbonden zijn. Eerste verdieping Op de eerste verdieping bevinden zich meerdere ruime slaapkamers, allen met een prettige lichtinval en een rustige uitstraling. De twee slaapkamers aan de achterzijde van de woning hebben toegang tot het riante balkon gelegen op het zuiden. Aan de voorzijde van de woning treffen we de royale hoofdslaapkamer uitzicht op het groen. De badkamer is compleet uitgevoerd met ligbad, douche, wastafel en toilet. Hoewel functioneel, biedt deze ruimte volop kansen om te transformeren tot een moderne wellness ruimte die aansluit bij jouw persoonlijke woonstijl. Zolderverdieping De zolderverdieping is een volwaardige extra woonlaag en verrast door de riante voorzolder met gelegenheid tot het creëren van een wasruimte, berging of kantoor. Dankzij de dakkapel is hier een ruime slaapkamer ontstaan, perfect als tienerkamer, logeerkamer of rustige thuiswerkplek. Ook deze verdieping biedt mogelijkheden om verder te optimaliseren en in te richten naar eigen smaak. Tuin Rondom de woning ligt een brede, fraai ingedeelde tuin met meerdere terrassen en veel privacy. De tuin is een heerlijke plek om te ontspannen en biedt volop ruimte voor spelende kinderen, tuinliefhebbers of lange zomeravonden met vrienden. Door de grootte en ligging zijn hier eenvoudig verschillende sferen te creëren: van een zonnig terras tot een beschutte loungehoek mede dankzij de fantastische ligging op het zuiden. Daarnaast beschikt de woning over een vrijstaande stenen garage, ideaal voor hobby, opslag of het parkeren van een auto. Voor de garage is er mogelijkheid tot het parkeren op eigen terrein voor 2 auto's. De woonwijk/ligging Dreef 34 is gelegen in een rustige, groene woonwijk met een prettige, ruim opgezette structuur. In de directe omgeving vind je scholen, winkels, sportvoorzieningen, het strand en openbaar vervoer. Ook de uitvalswegen richting Haarlem, Alkmaar en Amsterdam zijn snel bereikbaar. Een fijne plek voor gezinnen en iedereen die comfortabel wil wonen met alle voorzieningen binnen handbereik. BIJZONDERHEDEN - Royale twee-onder-een-kapwoning op een hoekperceel van maar liefst 425 m2; - Ruime en sfeervolle woonkamer mét open haard; - Vier volwaardige slaapkamers; - Volop mogelijkheden om de woning geheel naar eigen smaak en stijl te moderniseren; - Fantastisch brede en zonnige tuin met veel privacy; - Vrijstaande stenen garage; - Parkeren op eigen terrein; - CV-ketel Remeha (2023); - Gelegen in een rustige, groene woonomgeving. Aanvaarding in overleg. Interesse in dit huis? Schakel direct jouw eigen NVM-aankoopmakelaar in. Jouw NVM-aankoopmakelaar komt op voor jouw belang en bespaart je tijd, geld en zorgen. Adressen van collega NVM-aankoopmakelaars vind je op Funda.
€ 765.000
Cost of copper (estimated): € 17.150
2% transfer tax (€ 15.300) + notary (€ 1.150) + valuation (€ 700)
Total purchase (incl. p.p.): € 782.150
3,21%
Yearly
€ 38.250
Direct available
Estimated mortgage
Indicative gross monthly cost
Based on annuity and 30 year term
Indicative net monthly cost
iDisclaimer: this mortgage calculation is a simplified indication based on general assumptions. No rights can be derived from the results shown. Calculated with 10-annual interest (zonder NHG), automatically determined based on the price limit € 470.000. Source: 10-jaars rente uit mortgage_rates (09-06-2026 03:45). For non-NHG, an 80% mortgage of the market value has been used in this indication.
Douche, ligbad, toilet, en wastafelmeubel
Elektra
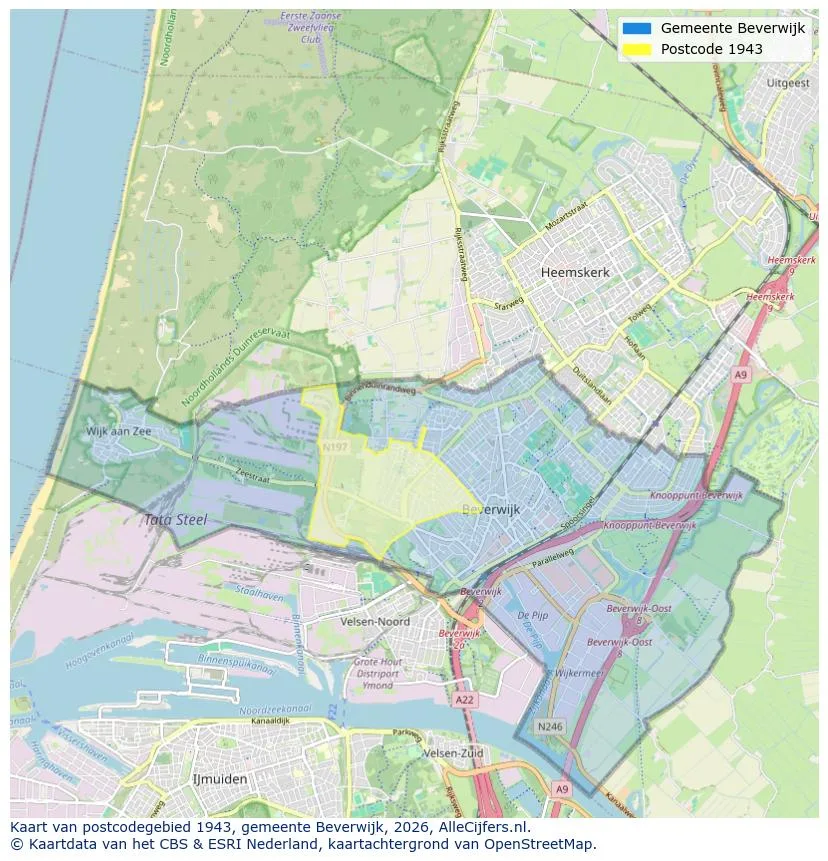
Explore Beverwijk and the surrounding areas
View current location data on residents, WOZ development, housing stock, energy consumption, business activity and safety in Beverwijk. In 2025 were there 40.915 residents. The average WOZ value in 2025 is EUR 357.212.
Residents
40.915
Last year: 2025
Average WOZ
EUR 357.212
Last year: 2025
Average income per person.
EUR 29.731
Source: AllNumbers
Crimes (current year)
1.779
Total registered
| Year | Residents |
|---|---|
| 2021 | 39.690 |
| 2022 | 39.915 |
| 2023 | 40.515 |
| 2024 | 40.705 |
| 2025 | 40.915 |
| Year | Average WOZ |
|---|---|
| 2021 | EUR 258.943 |
| 2022 | EUR 286.931 |
| 2023 | EUR 341.943 |
| 2024 | EUR 336.624 |
| 2025 | EUR 357.212 |
Hoger
7.530
Praktisch
9.000
Middelbaar
14.160
Europa
4.410
Nederland
27.555
Buiten Europa
8.950
Label C
5.027
Label A
5.010
Label B
2.753
Label G
1.671
Label D
1.393
Label E
1.262
Label F
1.148
Label A+
596
Label A+++
507
Label A++
260
Label A++++
105
Label A+++++
1
| Year | Gas (m3) | Electricity (kWh) |
|---|---|---|
| 2020 | 1.044 | 2.565 |
| 2021 | 1.187 | 2.609 |
| 2022 | 919 | 2.434 |
| 2023 | 803 | 2.282 |
| 2024 | 787 | 2.315 |
Hoekwoning
Gas: 1.005 • Electricity: 2.715
Huurwoning
Gas: 716 • Electricity: 1.850
Koopwoning
Gas: 865 • Electricity: 2.597
Appartement
Gas: 648 • Electricity: 1.779
Tussenwoning
Gas: 829 • Electricity: 2.476
Vrijstaande woning
Gas: 1.211 • Electricity: 3.104
Twee-onder-één-kap woning
Gas: 1.080 • Electricity: 2.870
Total number of company establishments: 5.630
| Period | Crimes |
|---|---|
| jan 2025 | 156 |
| jan 2026 | 135 |
| jul 2025 | 158 |
| jun 2025 | 131 |
| mei 2025 | 137 |
| mrt 2025 | 179 |
| nov 2024 | 150 |
| nov 2025 | 118 |
| okt 2024 | 152 |
| okt 2025 | 137 |
| sep 2024 | 173 |
| sep 2025 | 131 |
These figures give an indicative picture of safety trends in the living environment of Beverwijk.
Short answers based on current local statistics, handy for a quick comparison of the living environment.
Beverwijk telt in 2025 ongeveer 40.915 inwoners.
De gemiddelde WOZ-waarde in Beverwijk is in 2025 circa € 357.212.
Het gemiddelde inkomen per inwoner in Beverwijk ligt rond € 29.731 per jaar.
Voor het huidige jaar gaat het om ongeveer 1.779 geregistreerde misdrijven. Gebruik deze cijfers als indicatie en vergelijk trends per periode.
In Beverwijk komt vooral "Appartementen" veel voor, met ongeveer 9.009 woningen.
View more homes in this location.
1942AK Beverwijk
€ 425.000 k.k.
€ 4.048/m²
1944KP Beverwijk
€ 475.000 k.k.
€ 3.545/m²
1942LH Beverwijk
€ 1.250.000 k.k.
€ 6.443/m²
1942AE Beverwijk
€ 775.000 k.k.
€ 4.968/m²
1942LT Beverwijk
€ 775.000 k.k.
€ 5.132/m²
1942LR Beverwijk
€ 525.000 k.k.
€ 4.565/m²

1943BB Beverwijk
€ 925.000 k.k.
1942EN Beverwijk
€ 625.000 k.k.
€ 3.765/m²
