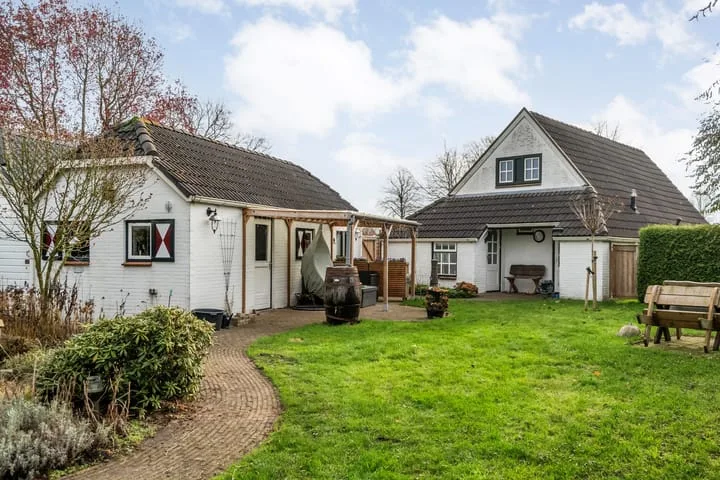
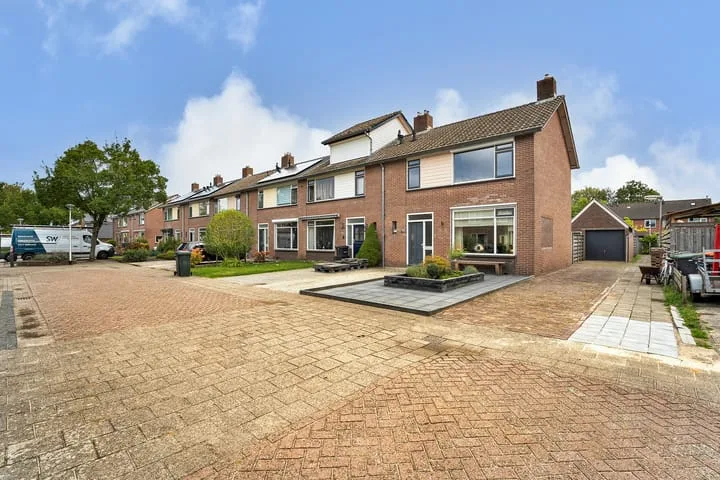
- Sold
Horstra's wijk 37 b
7782RA De Krim
€ 389.500 k.k.
€ 3.329/m²
- Living area
- 117 m²
- Land area
- 410 m²
- Bedrooms
- 3
View 16 sold houses in De Krim
Type to search. Use arrow down and arrow up to navigate through results and press Enter to open.
Hidden search suggestions.
Compare sold homes in De Krim or view the current offering in this location directly.
On this page you will find recently sold homes in De Krim. Use this overview to better estimate selling prices, popular neighborhoods, and the local housing supply before you choose a real estate agent. Also view the current housing supply with 22 houses in De Krim.
7782RA De Krim
€ 389.500 k.k.
€ 3.329/m²
7782SL De Krim
€ 435.000 k.k.
€ 2.919/m²
7782ST De Krim
€ 349.500 k.k.
€ 2.444/m²
7782PJ De Krim
€ 619.500 k.k.
€ 2.828/m²
7782PE De Krim
€ 550.000 k.k.
€ 2.000/m²
7782PH De Krim
€ 469.000 k.k.
€ 4.466/m²
7782PS De Krim
€ 550.000 k.k.
€ 2.140/m²
7782PP De Krim
€ 395.000 k.k.
€ 3.347/m²
7782RK De Krim
€ 325.000 k.k.
€ 2.425/m²
7782RC De Krim
€ 295.000 k.k.
€ 3.641/m²
7782RL De Krim
Price upon request
7782PP De Krim
€ 510.000 k.k.
€ 3.227/m²
7782SL De Krim
€ 439.000 k.k.
€ 2.814/m²
7782SV De Krim
€ 730.000 k.k.
€ 2.409/m²
7781PK De Krim
€ 795.000 k.k.
€ 1.437/m²
7782RW De Krim
€ 395.000 k.k.
€ 3.211/m²
View recent sales and receive free quotes from local real estate agents. Compare more than 19 real estate agents in De Krim.
Selling your own home in De Krim? Compare real estate agents in De Krim or view the best real estate agents in De Krim as a reference for your choice.
Real estate agents make sharper offers when they know you're comparing — ask for quotes for sale or purchase.
Short answers about housing prices, sold homes and comparing real estate agents in De Krim.
The costs of a real estate agent in De Krim vary per office, property type and sales approach. In De Krim you can compare 19 real estate agents; therefore also look at the real estate agents in De Krim to better compare fees, presentation and local experience.
On this page we currently show 16 sold houses in De Krim from our selection. This helps you to better assess recent transactions and the local housing market.
Houses sold in De Krim give insight into asking prices, house types and neighborhoods where recent transactions have taken place. Compare this also with the current housing stock in De Krim to better understand the market.
You can use sold homes as a first market indication, but a local real estate agent can better take into account finishing, location, maintenance and current demand in De Krim.
Compare the 19 real estate agents in De Krim on local sales experience, reviews, expected yield, commission and marketing approach. View real estate agents in De Krim or the top 10 agents in De Krim to quickly discover strong offices.
View current location data on residents, WOZ development, housing stock, energy consumption, business activity and safety in De Krim. In 2026 were there 2.176 residents. The average WOZ value in 2025 is EUR 328.000.
These figures help to better assess and compare the housing stock in De Krim with recent sold homes. Orient yourself then on suitable top real estate agents in De Krim for sales advice in this region.
Residents
2.176
Last year: 2026
Average WOZ
EUR 328.000
Last year: 2025
Average income per person.
EUR 26.900
Source: AllNumbers
Crimes (current year)
42
Total registered
| Year | Residents |
|---|---|
| 2021 | 2.195 |
| 2022 | 2.225 |
| 2023 | 2.205 |
| 2024 | 2.205 |
| 2025 | 2.195 |
| 2026 | 2.176 |
| Year | Average WOZ |
|---|---|
| 2021 | EUR 221.000 |
| 2022 | EUR 251.000 |
| 2023 | EUR 283.000 |
| 2024 | EUR 305.000 |
| 2025 | EUR 328.000 |
Hoger
220
Praktisch
640
Middelbaar
810
Europa
55
Nederland
2.090
Buiten Europa
45
Label A
231
Label G
179
Label C
143
Label B
91
Label F
82
Label D
78
Label E
52
Label A+
40
Label A++++
9
Label A+++
6
Label A++
0
Label A+++++
0
| Year | Gas (m3) | Electricity (kWh) |
|---|---|---|
| 2020 | 1.490 | 3.330 |
| 2021 | 1.790 | 3.350 |
| 2022 | 1.400 | 3.200 |
| 2023 | 1.150 | 3.050 |
| 2024 | 1.060 | 3.210 |
Hoekwoning
Gas: 940 • Electricity: 2.310
Huurwoning
Gas: 860 • Electricity: 2.010
Koopwoning
Gas: 1.250 • Electricity: 3.430
Appartement
Gas: 930 • Electricity: 2.100
Tussenwoning
Gas: 910 • Electricity: 2.160
Vrijstaande woning
Gas: 1.370 • Electricity: 3.790
Twee-onder-één-kap woning
Gas: 1.090 • Electricity: 3.130
Total number of company establishments: 270
| Period | Crimes |
|---|---|
| jan 2026 | 1 |
| jul 2025 | 3 |
| jun 2025 | 2 |
| mei 2025 | 4 |
| mrt 2025 | 2 |
| mrt 2026 | 5 |
| nov 2024 | 2 |
| nov 2025 | 3 |
| okt 2024 | 4 |
| okt 2025 | 2 |
| sep 2024 | 5 |
| sep 2025 | 3 |
These figures give an indicative picture of safety trends in the living environment of De Krim.
Short answers based on current local statistics, handy for a quick comparison of the living environment.
De Krim telt in 2026 ongeveer 2.176 inwoners.
De gemiddelde WOZ-waarde in De Krim is in 2025 circa € 328.000.
Het gemiddelde inkomen per inwoner in De Krim ligt rond € 26.900 per jaar.
Voor het huidige jaar gaat het om ongeveer 42 geregistreerde misdrijven. Gebruik deze cijfers als indicatie en vergelijk trends per periode.
In De Krim komt vooral "Vrijstaande woningen" veel voor, met ongeveer 415 woningen.