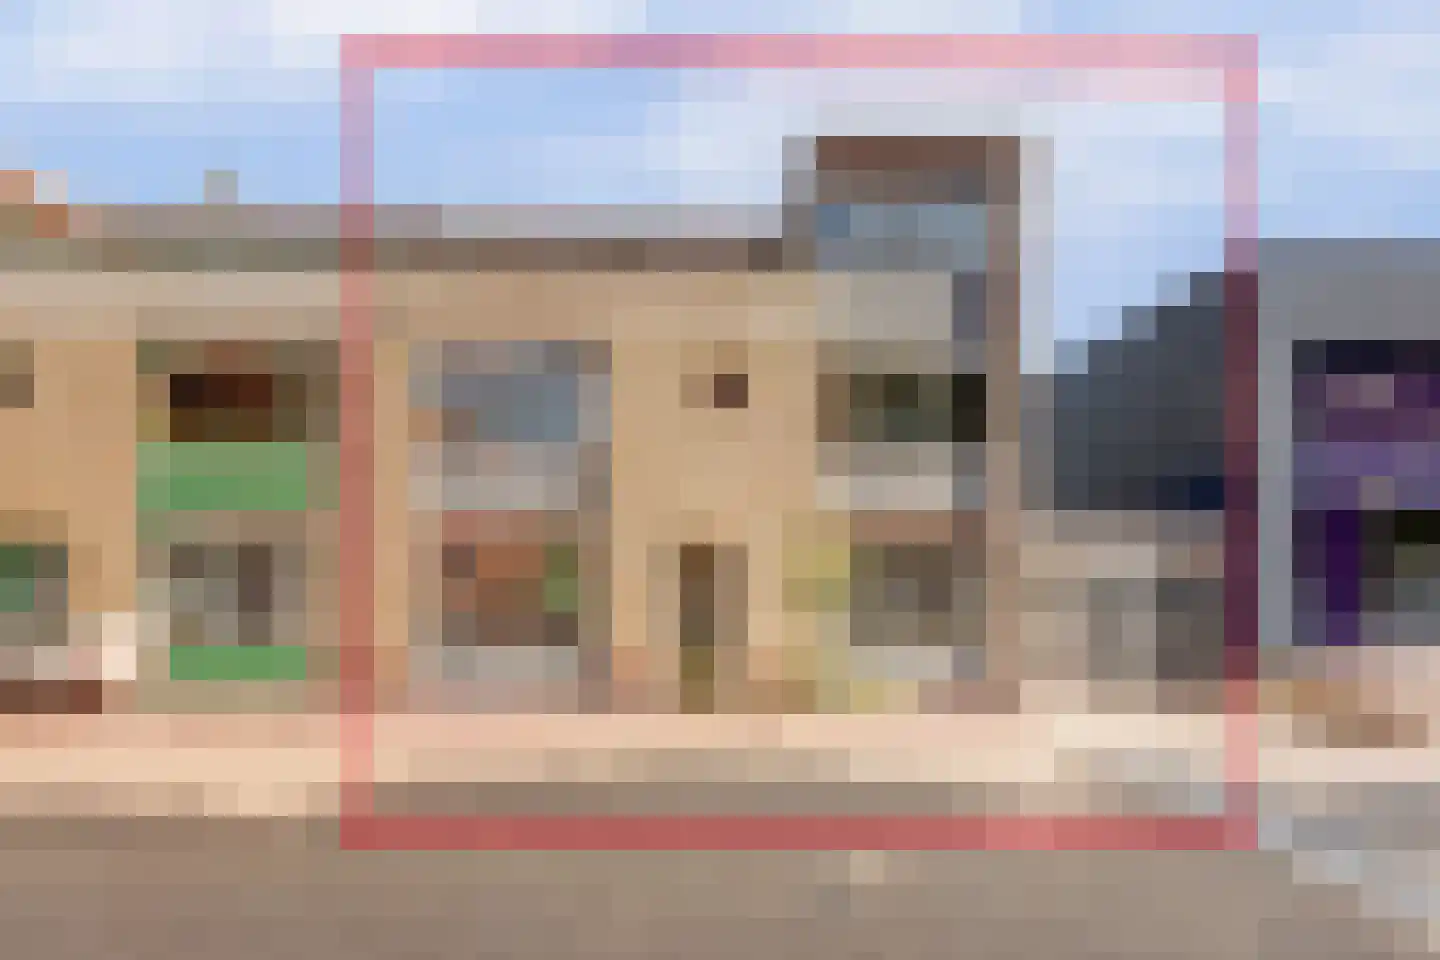
Housing offer in De Lier

Searching in 171 houses in De Lier

Connected to: Vastgoed Nederland NVM Makelaars

View the current housing stock in De Lier and quickly filter by price, living area, rooms and more. There are currently 171 houses in this place within our selection. View also 141 sold houses in De Lier for extra insight into the local housing market.

Selection

Search and filter homes

Set your preferences and discover homes that suit you.

Total supply 243.520
Filters

Set price, area and other characteristics. Adjust a filter or click on Show homes. Location changes directly above.

Reset filters

You search for

  • Place De Lier

Selling a home in De Lier? Compare realtor offers

Get free quotes from real estate agents with local market knowledge. Compare more than 114 real estate agents in De Lier.

Free request a quote

  • Quotes in De Lier
  • Non-binding
  • Personal
  • Compare free rates

Selling a home in De Lier? View the sales-oriented guide sell a house in De Lier, compare all real estate agents in De Lier or view the top 10 real estate agents in De Lier for extra context to your choice.

Compare multiple quotes

Real estate agents make sharper offers when they know you're comparing — ask for quotes for sale or purchase.

Frequently asked questions about homes in De Lier

Practical answers about housing supply, sales and comparing real estate agents in De Lier.

Residential and neighborhood statistics in De Lier

View current location data on residents, WOZ development, housing stock, energy consumption, business activity and safety in De Lier. In 2025 were there 13.300 residents. The average WOZ value in 2025 is EUR 458.000.

These figures help to better assess and compare the housing stock in De Lier with recent sold homes. Orient yourself then on suitable top real estate agents in De Lier for sales advice in this region.

Residents

13.300

Last year: 2025

Average WOZ

EUR 458.000

Last year: 2025

Average income per person.

EUR 33.500

Source: AllNumbers

Crimes (current year)

275

Total registered

Demographics and WOZ development

Inhabitants per year

Inhabitants per year in De Lier
Year Residents
2021 12.480
2022 12.455
2023 12.830
2024 13.130
2025 13.300

Annual WOZ value

WOZ value per year in De Lier
Year Average WOZ
2021 EUR 344.000
2022 EUR 374.000
2023 EUR 425.000
2024 EUR 441.000
2025 EUR 458.000

Composition of residents

Age build-up

65+: 2.630 0-15: 2.180 15-25: 1.555 25-45: 3.390 45-65: 3.550

Education level

Hoger

2.170

Praktisch

3.120

Middelbaar

4.380

Origin of residents (2025)

Europa

1.060

Nederland

11.245

Buiten Europa

1.000

Housing stock and construction periods

Types of homes

Hoekwoningen 1.024
Appartementen 1.198
Tussenwoningen 2.493
Vrijstaande woningen 869
Twee-onder-één-kap woningen 237

Construction period of buildings

Voor 1700 2
1700 tot 1900 22
1900 tot 1925 98
1925 tot 1950 296
1950 tot 1970 1.410
1970 tot 1980 896
1980 tot 1990 614
1990 tot 2000 611
2000 tot 2010 512
2010 tot 2020 347
2020 en later 627

Energy and sustainability

Energy label distribution

Label C

1.636

Label A

1.237

Label B

1.019

Label D

507

Label F

303

Label A+

277

Label E

242

Label G

193

Label A+++

189

Label A++

177

Label A+++++

11

Label A++++

4

Average energy consumption per year

Average energy consumption per year in De Lier
Year Gas (m3) Electricity (kWh)
2020 1.130 3.180
2021 1.300 3.240
2022 1.000 2.960
2023 850 2.730
2024 820 2.750

Consumption per house type

Hoekwoning

Gas: 900 • Electricity: 2.720

Huurwoning

Gas: 760 • Electricity: 2.170

Koopwoning

Gas: 890 • Electricity: 2.930

Appartement

Gas: 540 • Electricity: 1.830

Tussenwoning

Gas: 740 • Electricity: 2.530

Vrijstaande woning

Gas: 1.460 • Electricity: 4.200

Twee-onder-één-kap woning

Gas: 1.130 • Electricity: 3.350

Business activity in De Lier (2025)

Handel en HORECA 320
Nijverheid en energie 400
Zakelijke dienstverlening 540
Overheid, onderwijs en zorg 200
Landbouw, bosbouw en visserij 270
Vervoer, informatie en communicatie 130
Financiele diensten en onroerendgoed 165
Cultuur, recreatie en overige diensten 175

Total number of company establishments: 2.200

Recent crime statistics

Recent crime statistics in De Lier
Period Crimes
jan 2025 25
jan 2026 21
jul 2025 34
jun 2025 22
mei 2025 23
mrt 2025 22
nov 2024 30
nov 2025 20
okt 2024 44
okt 2025 22
sep 2024 25
sep 2025 20

These figures give an indicative picture of safety trends in the living environment of De Lier.

Frequently asked questions about living in De Lier

Short answers based on current local statistics, handy for a quick comparison of the living environment.

Hoeveel inwoners heeft De Lier?

De Lier telt in 2025 ongeveer 13.300 inwoners.

Wat is de gemiddelde WOZ-waarde in De Lier?

De gemiddelde WOZ-waarde in De Lier is in 2025 circa € 458.000.

Wat is het gemiddelde inkomen per inwoner in De Lier?

Het gemiddelde inkomen per inwoner in De Lier ligt rond € 33.500 per jaar.

Hoe veilig is wonen in De Lier?

Voor het huidige jaar gaat het om ongeveer 275 geregistreerde misdrijven. Gebruik deze cijfers als indicatie en vergelijk trends per periode.

Welke woningtypen komen het meest voor in De Lier?

In De Lier komt vooral "Tussenwoningen" veel voor, met ongeveer 2.493 woningen.

Receive free, non-binding quotes

Compare multiple real estate agents and choose the best match.