
Residents
3.950
Last year: 2025
7587PC de Lutte • Overijssel
For this property, no detailed description is available yet.
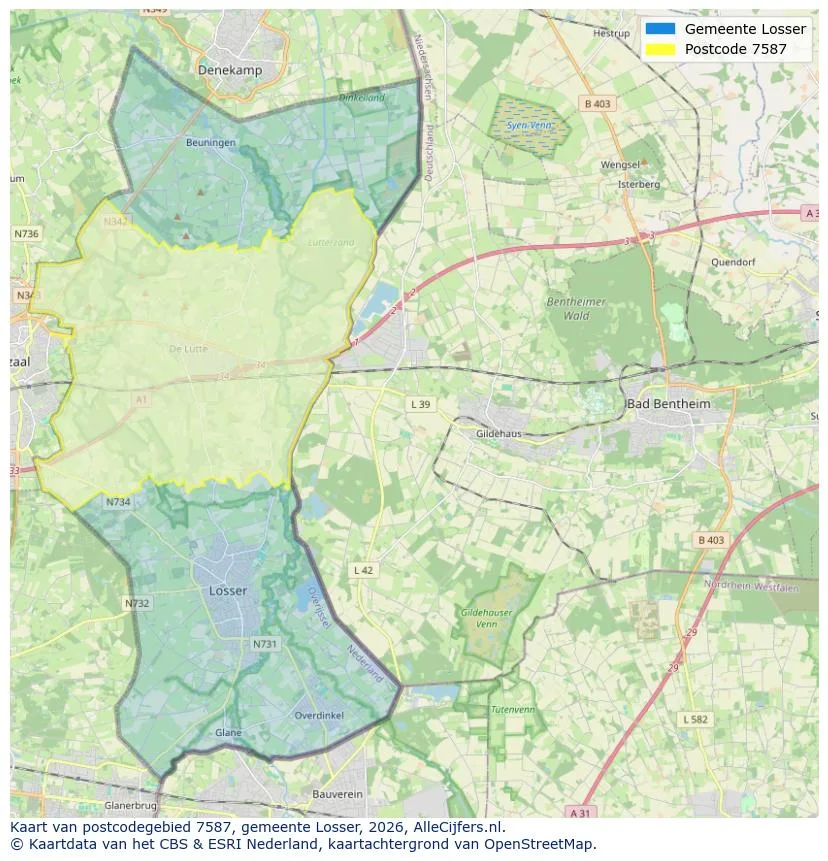
Explore de Lutte and the surrounding areas
View current location data on residents, WOZ development, housing stock, energy consumption, business activity and safety in de Lutte. In 2025 were there 3.950 residents. The average WOZ value in 2025 is EUR 496.000.
Residents
3.950
Last year: 2025
Average WOZ
EUR 496.000
Last year: 2025
Average income per person.
EUR 34.600
Source: AllNumbers
Crimes (current year)
132
Total registered
| Year | Residents |
|---|---|
| 2021 | 3.910 |
| 2022 | 3.900 |
| 2023 | 3.970 |
| 2024 | 3.945 |
| 2025 | 3.950 |
| Year | Average WOZ |
|---|---|
| 2021 | EUR 355.000 |
| 2022 | EUR 396.000 |
| 2023 | EUR 463.000 |
| 2024 | EUR 483.000 |
| 2025 | EUR 496.000 |
Hoger
940
Praktisch
690
Middelbaar
1.350
Europa
315
Nederland
3.545
Buiten Europa
95
Label A
464
Label B
384
Label C
300
Label D
166
Label G
144
Label F
130
Label A+++
91
Label E
67
Label A++
16
Label A+
12
Label A++++
4
Label A+++++
1
| Year | Gas (m3) | Electricity (kWh) |
|---|---|---|
| 2020 | 1.610 | 3.690 |
| 2021 | 1.830 | 3.830 |
| 2022 | 1.430 | 3.570 |
| 2023 | 1.160 | 3.430 |
| 2024 | 1.110 | 3.590 |
Hoekwoning
Gas: 1.000 • Electricity: 2.770
Huurwoning
Gas: 1.130 • Electricity: 2.860
Koopwoning
Gas: 1.170 • Electricity: 3.580
Appartement
Gas: 1.010 • Electricity: 2.990
Tussenwoning
Gas: 890 • Electricity: 2.740
Vrijstaande woning
Gas: 1.270 • Electricity: 3.820
Twee-onder-één-kap woning
Gas: 1.090 • Electricity: 3.030
Total number of company establishments: 615
| Period | Crimes |
|---|---|
| jan 2025 | 11 |
| jan 2026 | 12 |
| jul 2025 | 13 |
| jun 2025 | 11 |
| mei 2025 | 13 |
| mrt 2025 | 17 |
| nov 2024 | 7 |
| nov 2025 | 9 |
| okt 2024 | 8 |
| okt 2025 | 9 |
| sep 2024 | 6 |
| sep 2025 | 10 |
These figures give an indicative picture of safety trends in the living environment of de Lutte.
Short answers based on current local statistics, handy for a quick comparison of the living environment.
de Lutte telt in 2025 ongeveer 3.950 inwoners.
De gemiddelde WOZ-waarde in de Lutte is in 2025 circa € 496.000.
Het gemiddelde inkomen per inwoner in de Lutte ligt rond € 34.600 per jaar.
Voor het huidige jaar gaat het om ongeveer 132 geregistreerde misdrijven. Gebruik deze cijfers als indicatie en vergelijk trends per periode.
In de Lutte komt vooral "Vrijstaande woningen" veel voor, met ongeveer 961 woningen.
View more homes in this location.

7587RP de Lutte
€ 1.179.000 k.k.

7587RS de Lutte
€ 565.000 k.k.
€ 4.631/m²
7587BK de Lutte
€ 495.000 k.k.
€ 2.878/m²

7587RP de Lutte
€ 795.000 k.k.
€ 4.907/m²

7587SC de Lutte
€ 529.000 k.k.
€ 3.890/m²

7587NH de Lutte
€ 650.000 k.k.
€ 3.095/m²

7587RT de Lutte
€ 685.000
€ 5.000/m²

7587AE de Lutte
€ 298.000 k.k.
€ 3.136/m²
